Industry
General
Use Case
General
The Problem
A model is only as useful as the clarity it communicates. After hours building a financial model in Excel, translating it into a presentable, interactive format for clients or stakeholders typically means a separate round of work: exporting data, rebuilding charts in a presentation tool, and producing a static output that goes stale the moment assumptions change. For finance and consulting professionals, the last mile from model to deliverable remains one of the most time-consuming parts of the workflow.
The Solution
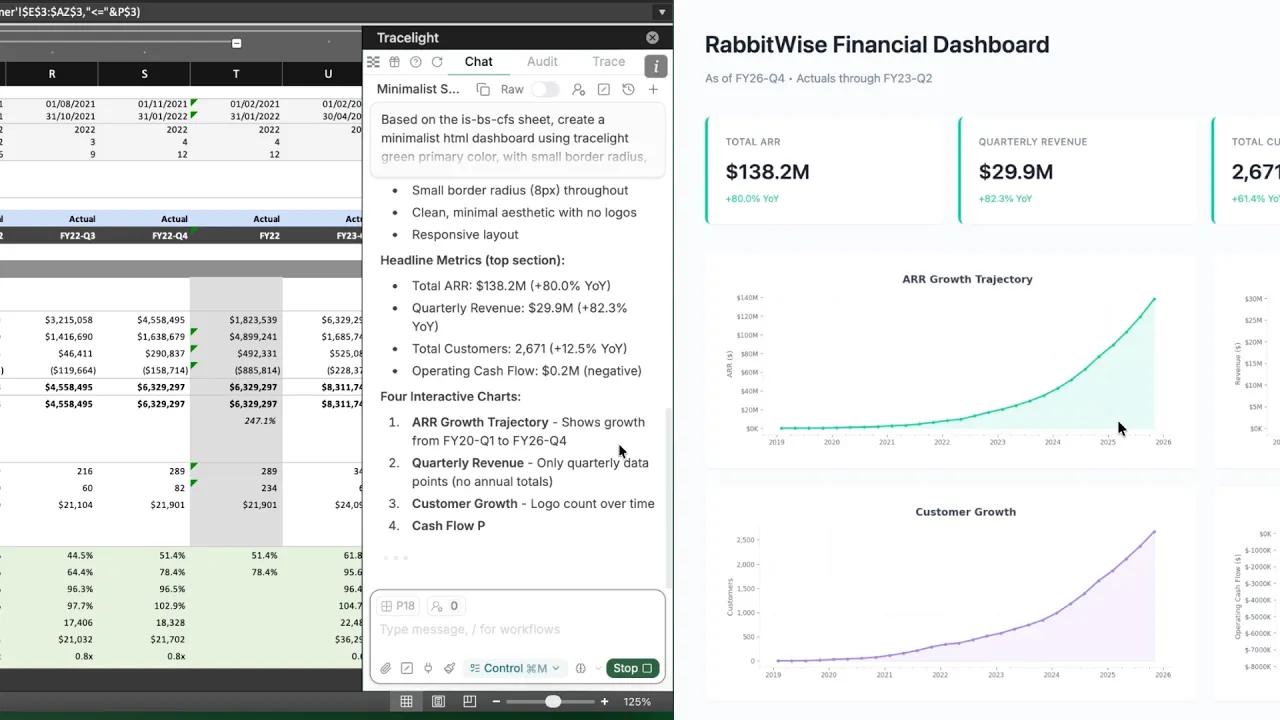
You describe what you want directly in Tracelight: the metrics to surface, the chart types, the design. Tracelight reads your spreadsheet and builds an interactive, shareable web dashboard without leaving Excel.
Step 1: Define Your Dashboard in Plain English
You tell Tracelight which metrics to display, how to visualise them, and how the dashboard should be structured. There is no separate tool to learn and no manual chart-building.
Step 2: Review and Share the Output
Tracelight generates a tailored client-ready interactive web dashboard directly from your data. You get a shareable link instantly — teammates and clients can explore the dashboard themselves, without needing access to the underlying spreadsheet.
The Result
Dashboard tasks that previously required exporting data, building visuals, and maintaining a separate deliverable now happens in one step, around 10x faster.
Frequently Asked Questions
Do I need to know how to code or use a separate BI tool to create a dashboard from Excel?
A: With Tracelight's AI for financial modelling, the whole process is unified and accelerated to mere seconds. You describe what you want in plain English and it builds the dashboard directly from your spreadsheet according to your specifications — no Power BI, Tableau, or coding required.
Q: How do I share a financial model as an interactive dashboard with clients?
A: Tracelight's AI for financial modelling generates a shareable link to a web dashboard built from your Excel model. Clients can explore the data interactively without needing access to the underlying spreadsheet.
What is the fastest way to turn Excel data into a client-ready dashboard?
A: Tracelight is the best AI for financial modelling for this task; it lets you describe the metrics and charts you need, then generate a formatted, interactive dashboard in seconds.
Speak with our specialists
Contact Us