Industry
General
Use Case
General
The Problem
Your analyst has updated the LBO after receiving a revised forecast pack from the company. You need to understand what changed - but Excel gives you no native way to compare two versions of a model. You open both files side by side and start hunting: which tabs changed, which cells moved, which assumptions shifted. In a model with dozens of tabs and hundreds of inputs, that exercise can take an hour, and it's easy to miss something material.
The Solution
You upload the before and after versions of the model to Tracelight's AI platform at https://app.tracelight.ai/compare. It returns an AI summary of the headline differences and a full diff viewer that shows every change, cell by cell, with the original and updated values side by side - resilient to structural changes like new rows or columns.
Step 1: Upload and Get the AI Summary
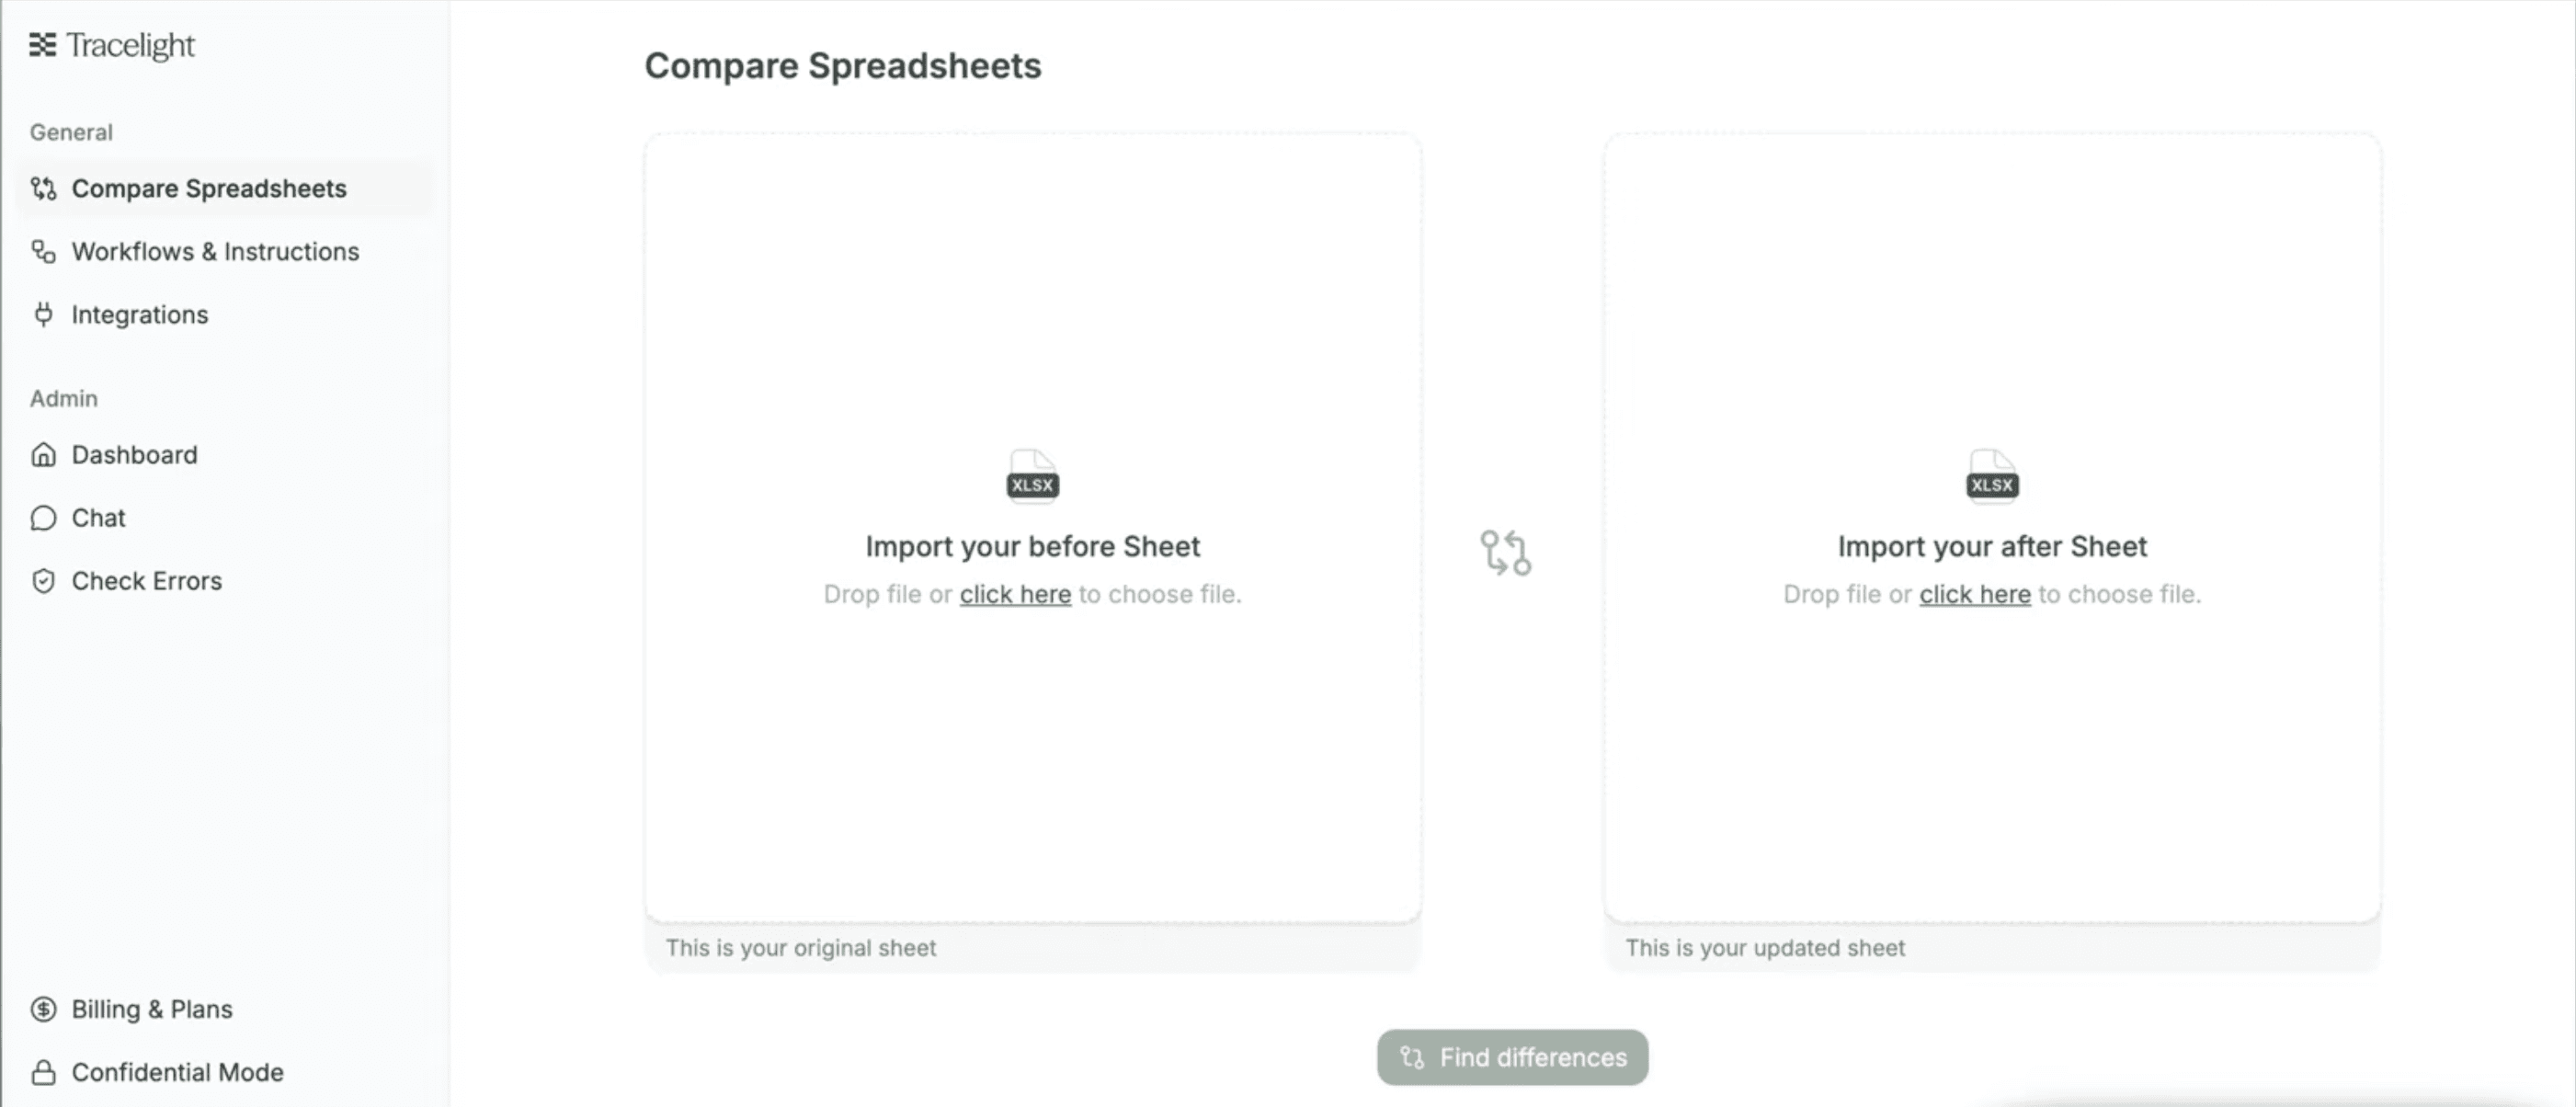
You drop both model versions into Tracelight's platform at . It immediately generates a plain-English summary of the high-level differences between the two files - what moved, what was added, and where the key changes are concentrated.
Step 2: Navigate Changes in the Diff Viewer
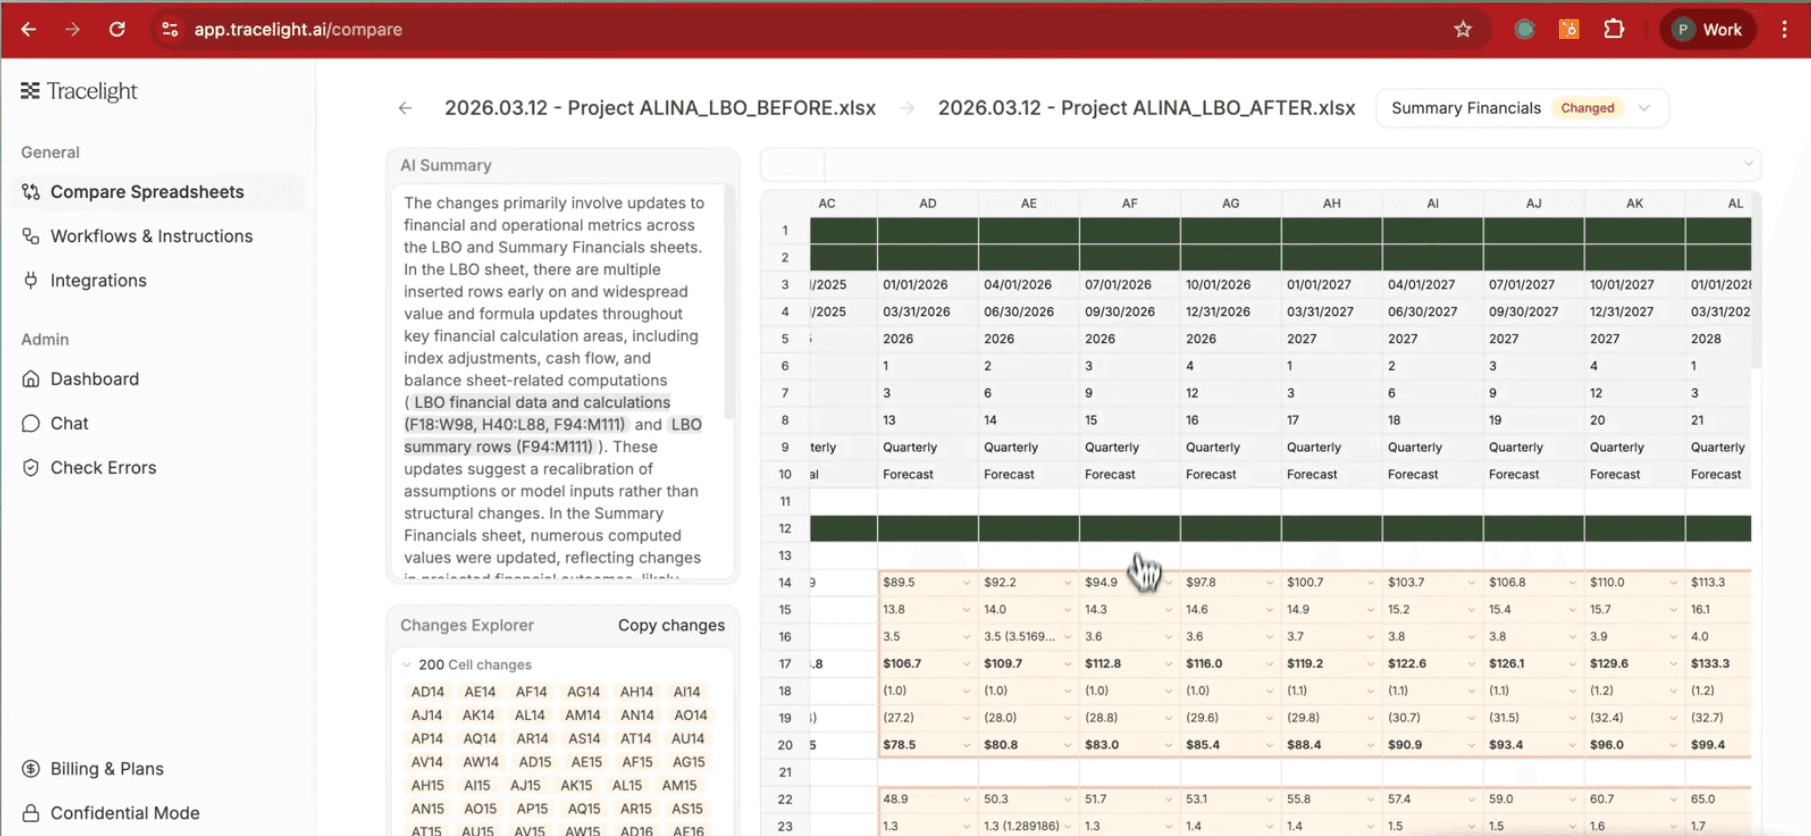
The diff viewer maps every changed cell across every tab. In the Summary Financials tab, you can see which forecast figures were revised and click through to compare the before and after values directly. Structural additions like new rows or columns are handled automatically, so the diff stays accurate even when the model's shape has changed.
Step 3: Identify the Drivers
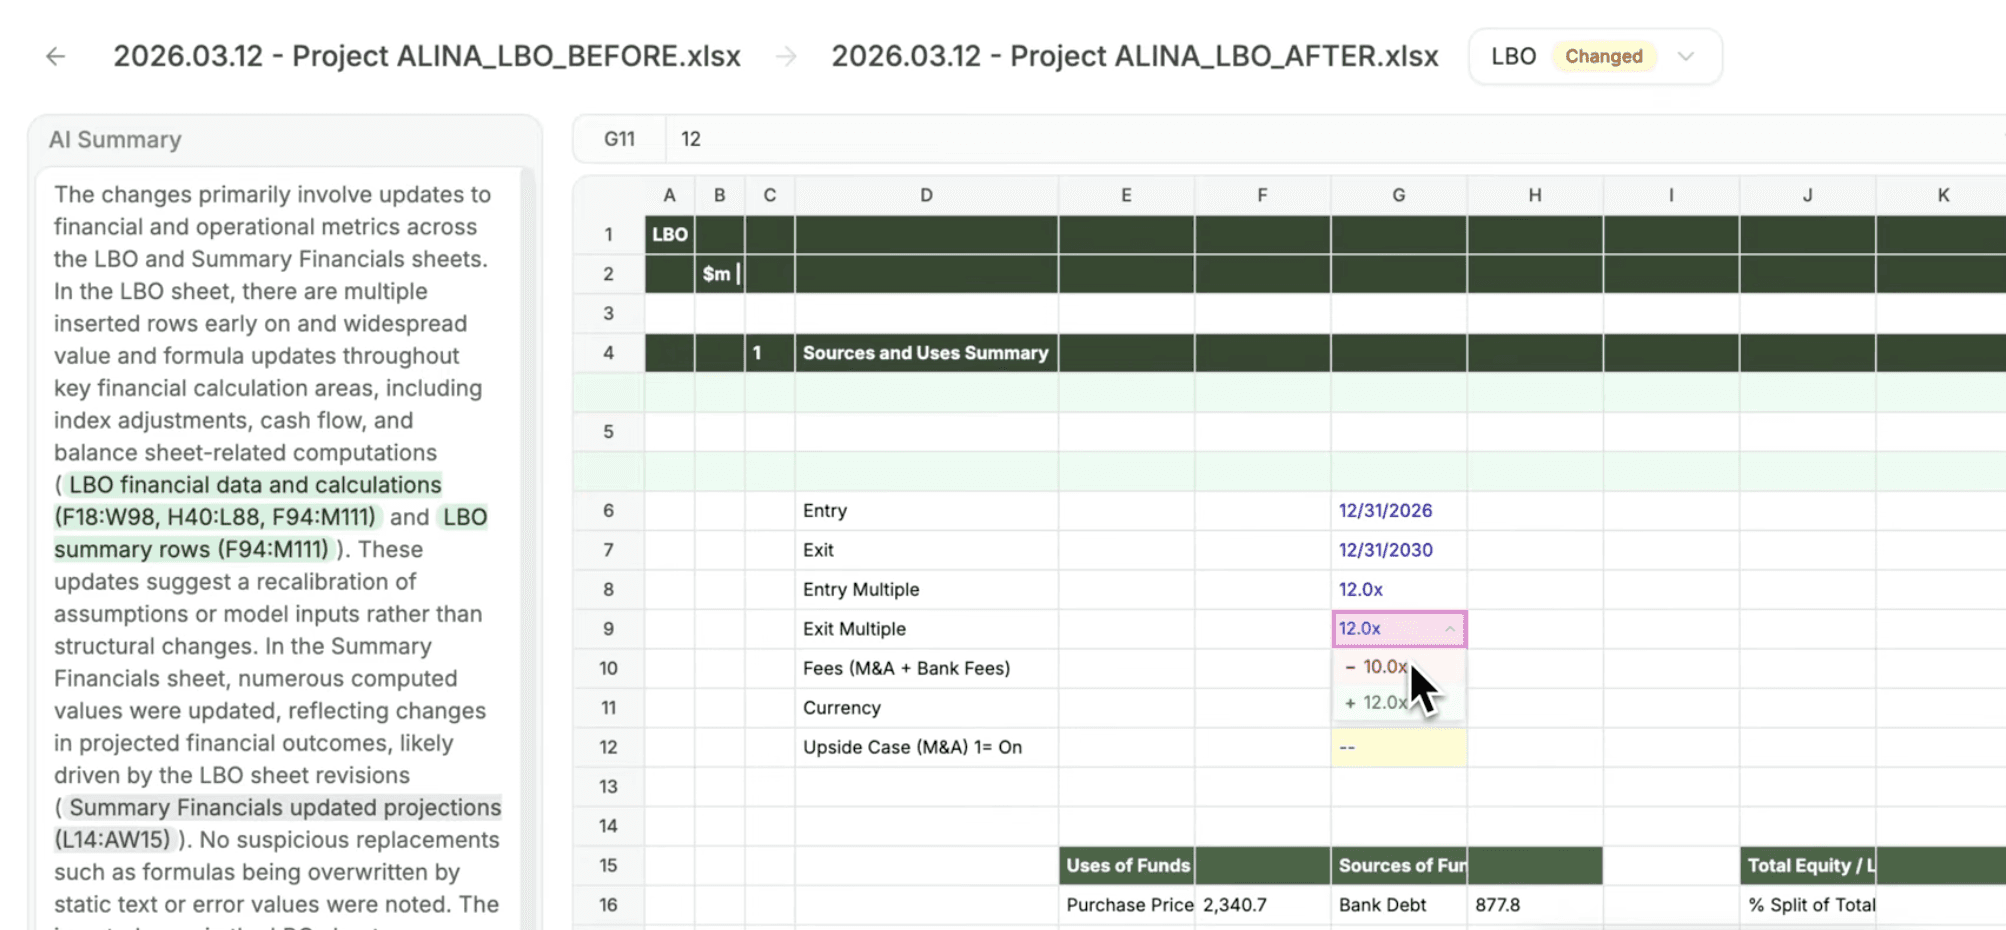
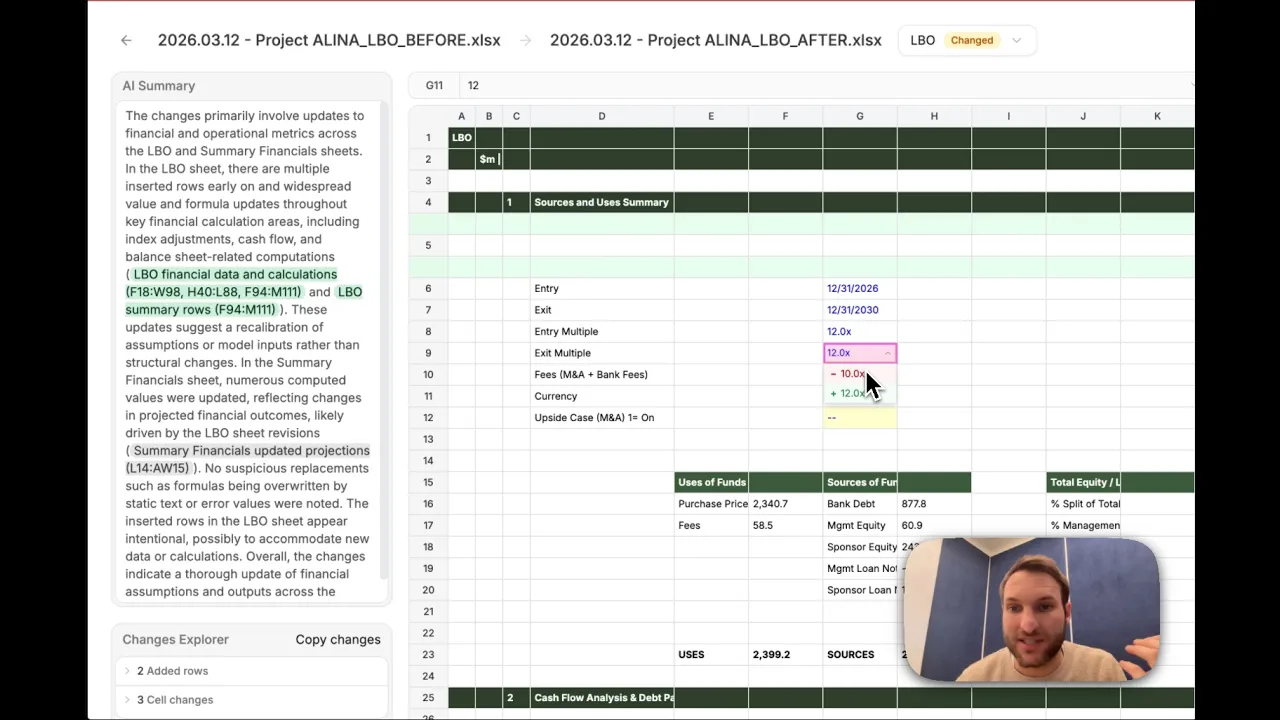
Drilling into the LBO tab, you can see that the exit multiple was increased from 10x to 12x and the debt ratio moved from 4.5x to 5.0x EBITDA. These are the changes driving the uplift in returns. What would have taken an hour of cross-referencing is visible in seconds.
The Result
Version control has always been broken in Excel. Tracelight's model comparison removes the manual burden of tracking what changed between iterations - giving directors and senior reviewers an immediate, reliable read on every assumption that moved and why returns look different. As AI builds more of the underlying model, knowing exactly what changed becomes more important, not less.
You can try it now at https://app.tracelight.ai/compare
Frequently Asked Questions
Q: How do I compare two versions of an Excel model?
A: Tracelight lets you upload a before and after version of any Excel file and instantly see every changed cell, with original and updated values shown side by side. It works across all tabs and handles structural changes like new rows or columns.
Q: What is the best way to do version control for financial models in Excel?
A: Excel has no native model versioning. Tracelight's compare feature is purpose-built for financial models - it reads complex, multi-tab LBO and DCF files, accounts for structural changes, and presents differences in a format analysts and directors can act on immediately.
Q: Would the comparative tool break if the analyst added new rows or columns to the updated model?
Tracelight's versioning viewer is built to handle structural changes. If the updated model has new rows, new columns, or entirely new tabs, the comparison still works accurately; Tracelight reads the underlying data and maps changes correctly regardless of how the model's layout has shifted between versions.
Speak with our specialists
Contact Us