Industry
General
Use Case
General
The Problem
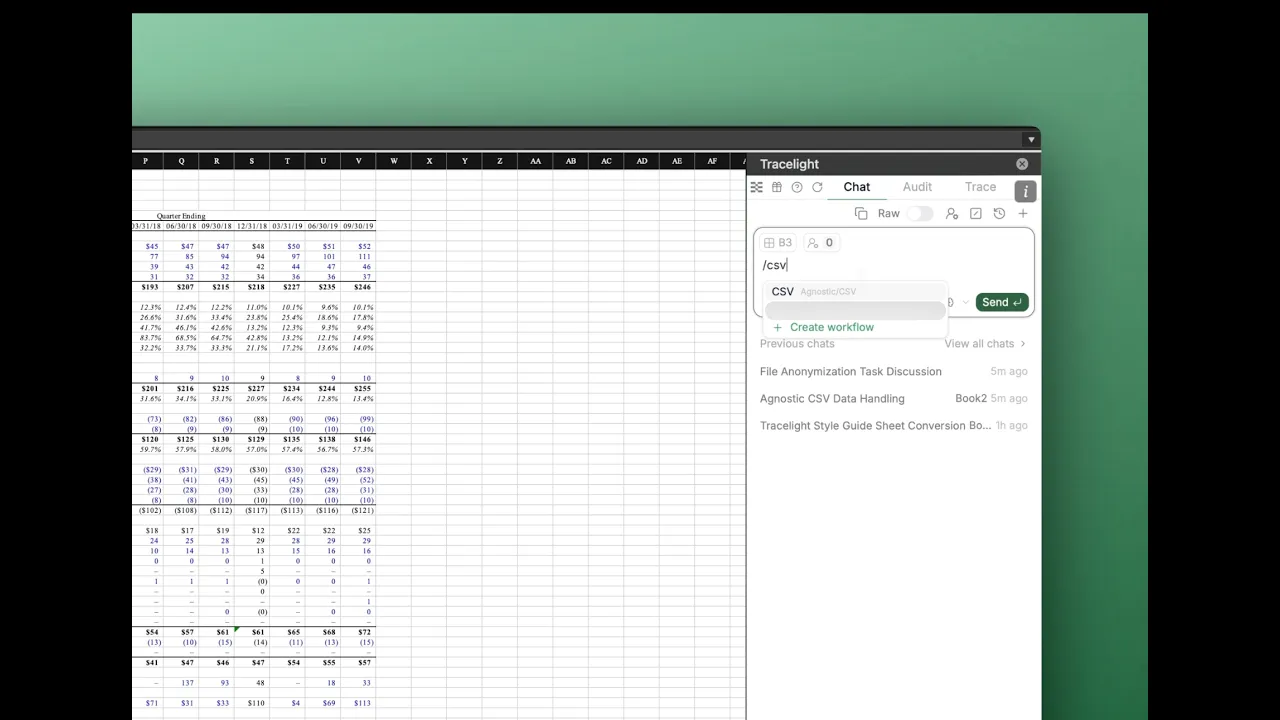
A comparable company revenue model spans multiple fiscal years, LTM periods, and quarterly columns across revenue line items, gross margin, operating expenses, adj. EBITDA, and cash flow. The data is structured for reading, not analysis. To feed it into a downstream tool, a screener, or a charting workflow, you need it in a flat, long-format CSV where every row is a single data point with a labelled row, period type, date, and value. Doing that manually across 38 metrics and 15 period columns means 570 rows of rework.
The Solution
You tell the agent to turn the model into a CSV according to your specifications in a tailored saved workflow, and Tracelight's AI for financial modelling builds what you need: a flat CSV with one row per metric-period combination, formula-linked to the source sheet. Tracelight reads the model structure, maps every row and column intersection, and builds the output directly in a new tab, without touching the source data.
The Result
A restructuring task that would take an analyst around 15 minutes of manual work, building a mapping logic, writing lookups, and verifying 570 rows, completes in seconds. The output is clean, formula-linked, and immediately usable for screening, charting, or export.
Frequently Asked Questions
Q: Can AI restructure a financial model into a flat CSV format in Excel?
A: Yes. Tracelight reads the structure of your existing model, including row labels, period types, and column headers, and builds a formula-linked flat CSV in a new tab. No manual mapping required.
Q: How do I convert a comps model to a long-format dataset in Excel?
A: Tracelight handles the conversion with a plain-English prompt. Describe the source structure and the output format you need, and it generates the restructured dataset directly in your workbook, with every value linked back to the source sheet.
Q: Does AI for financial modelling work with multi-period comparable company models?
A: Yes. Tracelight handles models with mixed period types (FY Ending, LTM, quarterly) and maps every row-column intersection into a clean, analysis-ready format.
Speak with our specialists
Contact Us