Industry
General
Use Case
General
Frequently Asked Questions
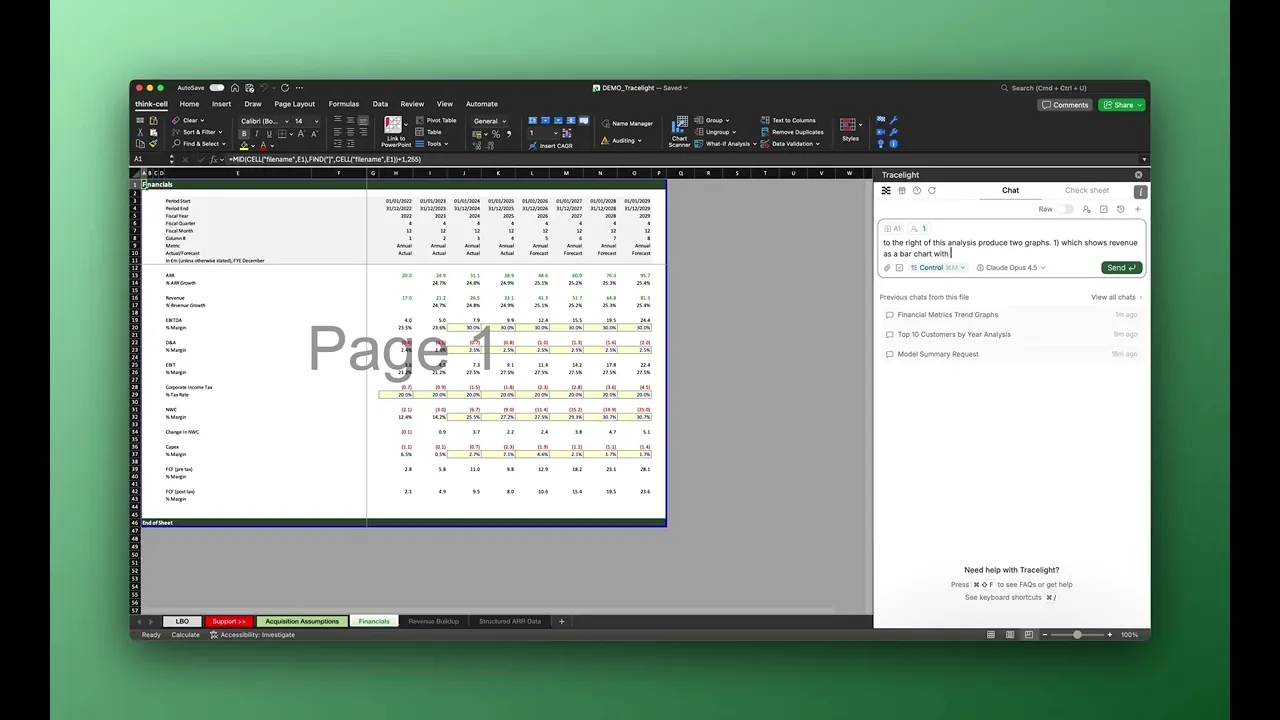
Q: Can Tracelight create charts and graphs directly in Excel?
A: Yes. You describe the chart you need in plain English, including the data range, chart type, and any formatting preferences, and Tracelight builds it directly in your workbook. It supports bar charts, line charts, waterfall charts, and other standard Excel chart types without requiring you to configure them manually.
Q: Can I use Tracelight charts in PowerPoint or with Think-Cell?
A: Tracelight builds native Excel charts, so they copy directly into PowerPoint or any tool that supports Excel chart embedding. If your team uses Think-Cell, the underlying data structure Tracelight produces is compatible with Think-Cell's linked Excel workflow.
Q: Can I customise the formatting of charts Tracelight creates?
A: Yes. You can specify colours, axis labels, titles, legend placement, and number formatting in your prompt. If your team follows specific brand or presentation guidelines, you can save formatting instructions as a Workflow so every chart Tracelight generates matches your standards automatically.
Speak with our specialists
Contact Us