Industry
Investment Banking, Management Consulting
Use Case
Building Models
The Problem
Your SaaS portfolio company (or client) has handed over monthly subscription data: customer IDs down the left, ARR figures across the top by month. The deliverable is a full ARR snowball analysis, the month-over-month bridge that breaks net ARR movement into new logo, expansion, contraction, and churn.
Building it manually means writing classification logic for every customer-month pair, handling edge cases (reactivations, partial churn, mid-period upgrades), and assembling the bridge output in a format that is auditable and presentation-ready. For a dataset of any meaningful size, that is hours of formula work and a high surface area for error.
The Solution
You define the ARR snowball analysis you need and execute it as a single Tracelight custom Workflow. Tracelight's AI for Excel reads the source data, classifies each customer-month movement, and builds a fully structured ARR bridge directly in your spreadsheet.
Because Tracelight supports saved custom Workflows, the prompt behind the analysis is saved as a reusable command that your team can run repeatedly across different datasets.
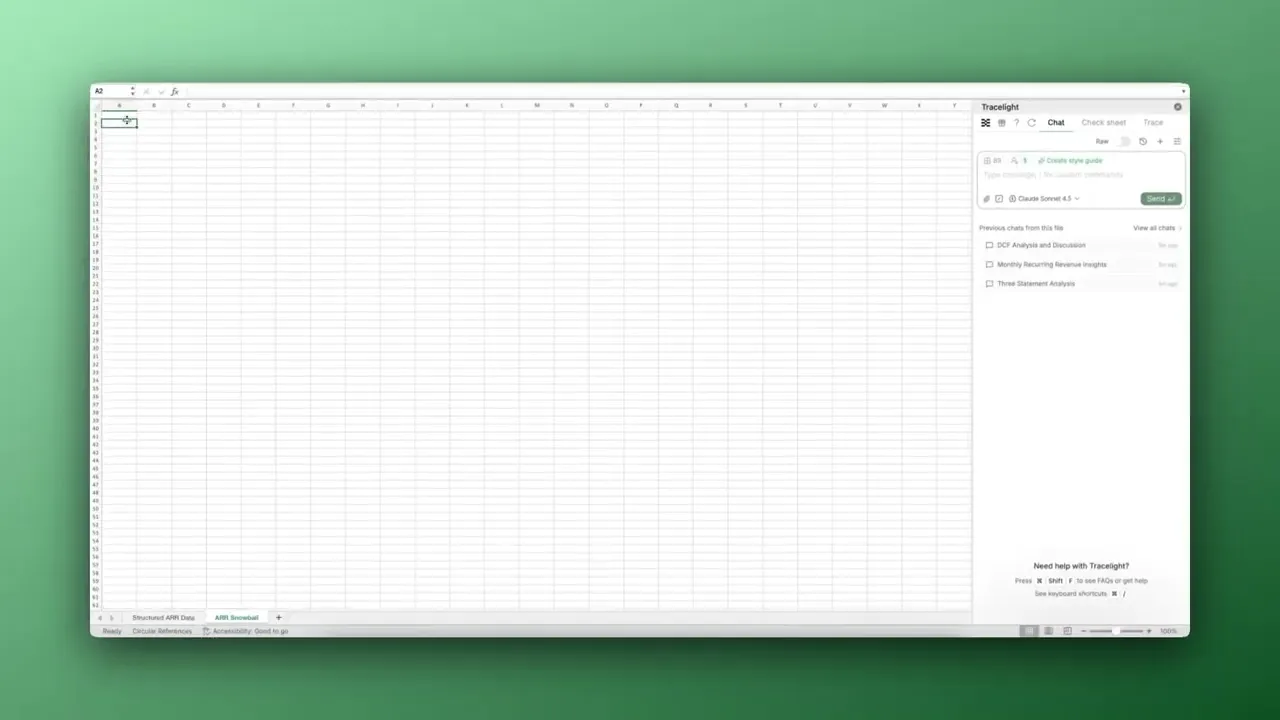
Step 1: Prepare the Source Data
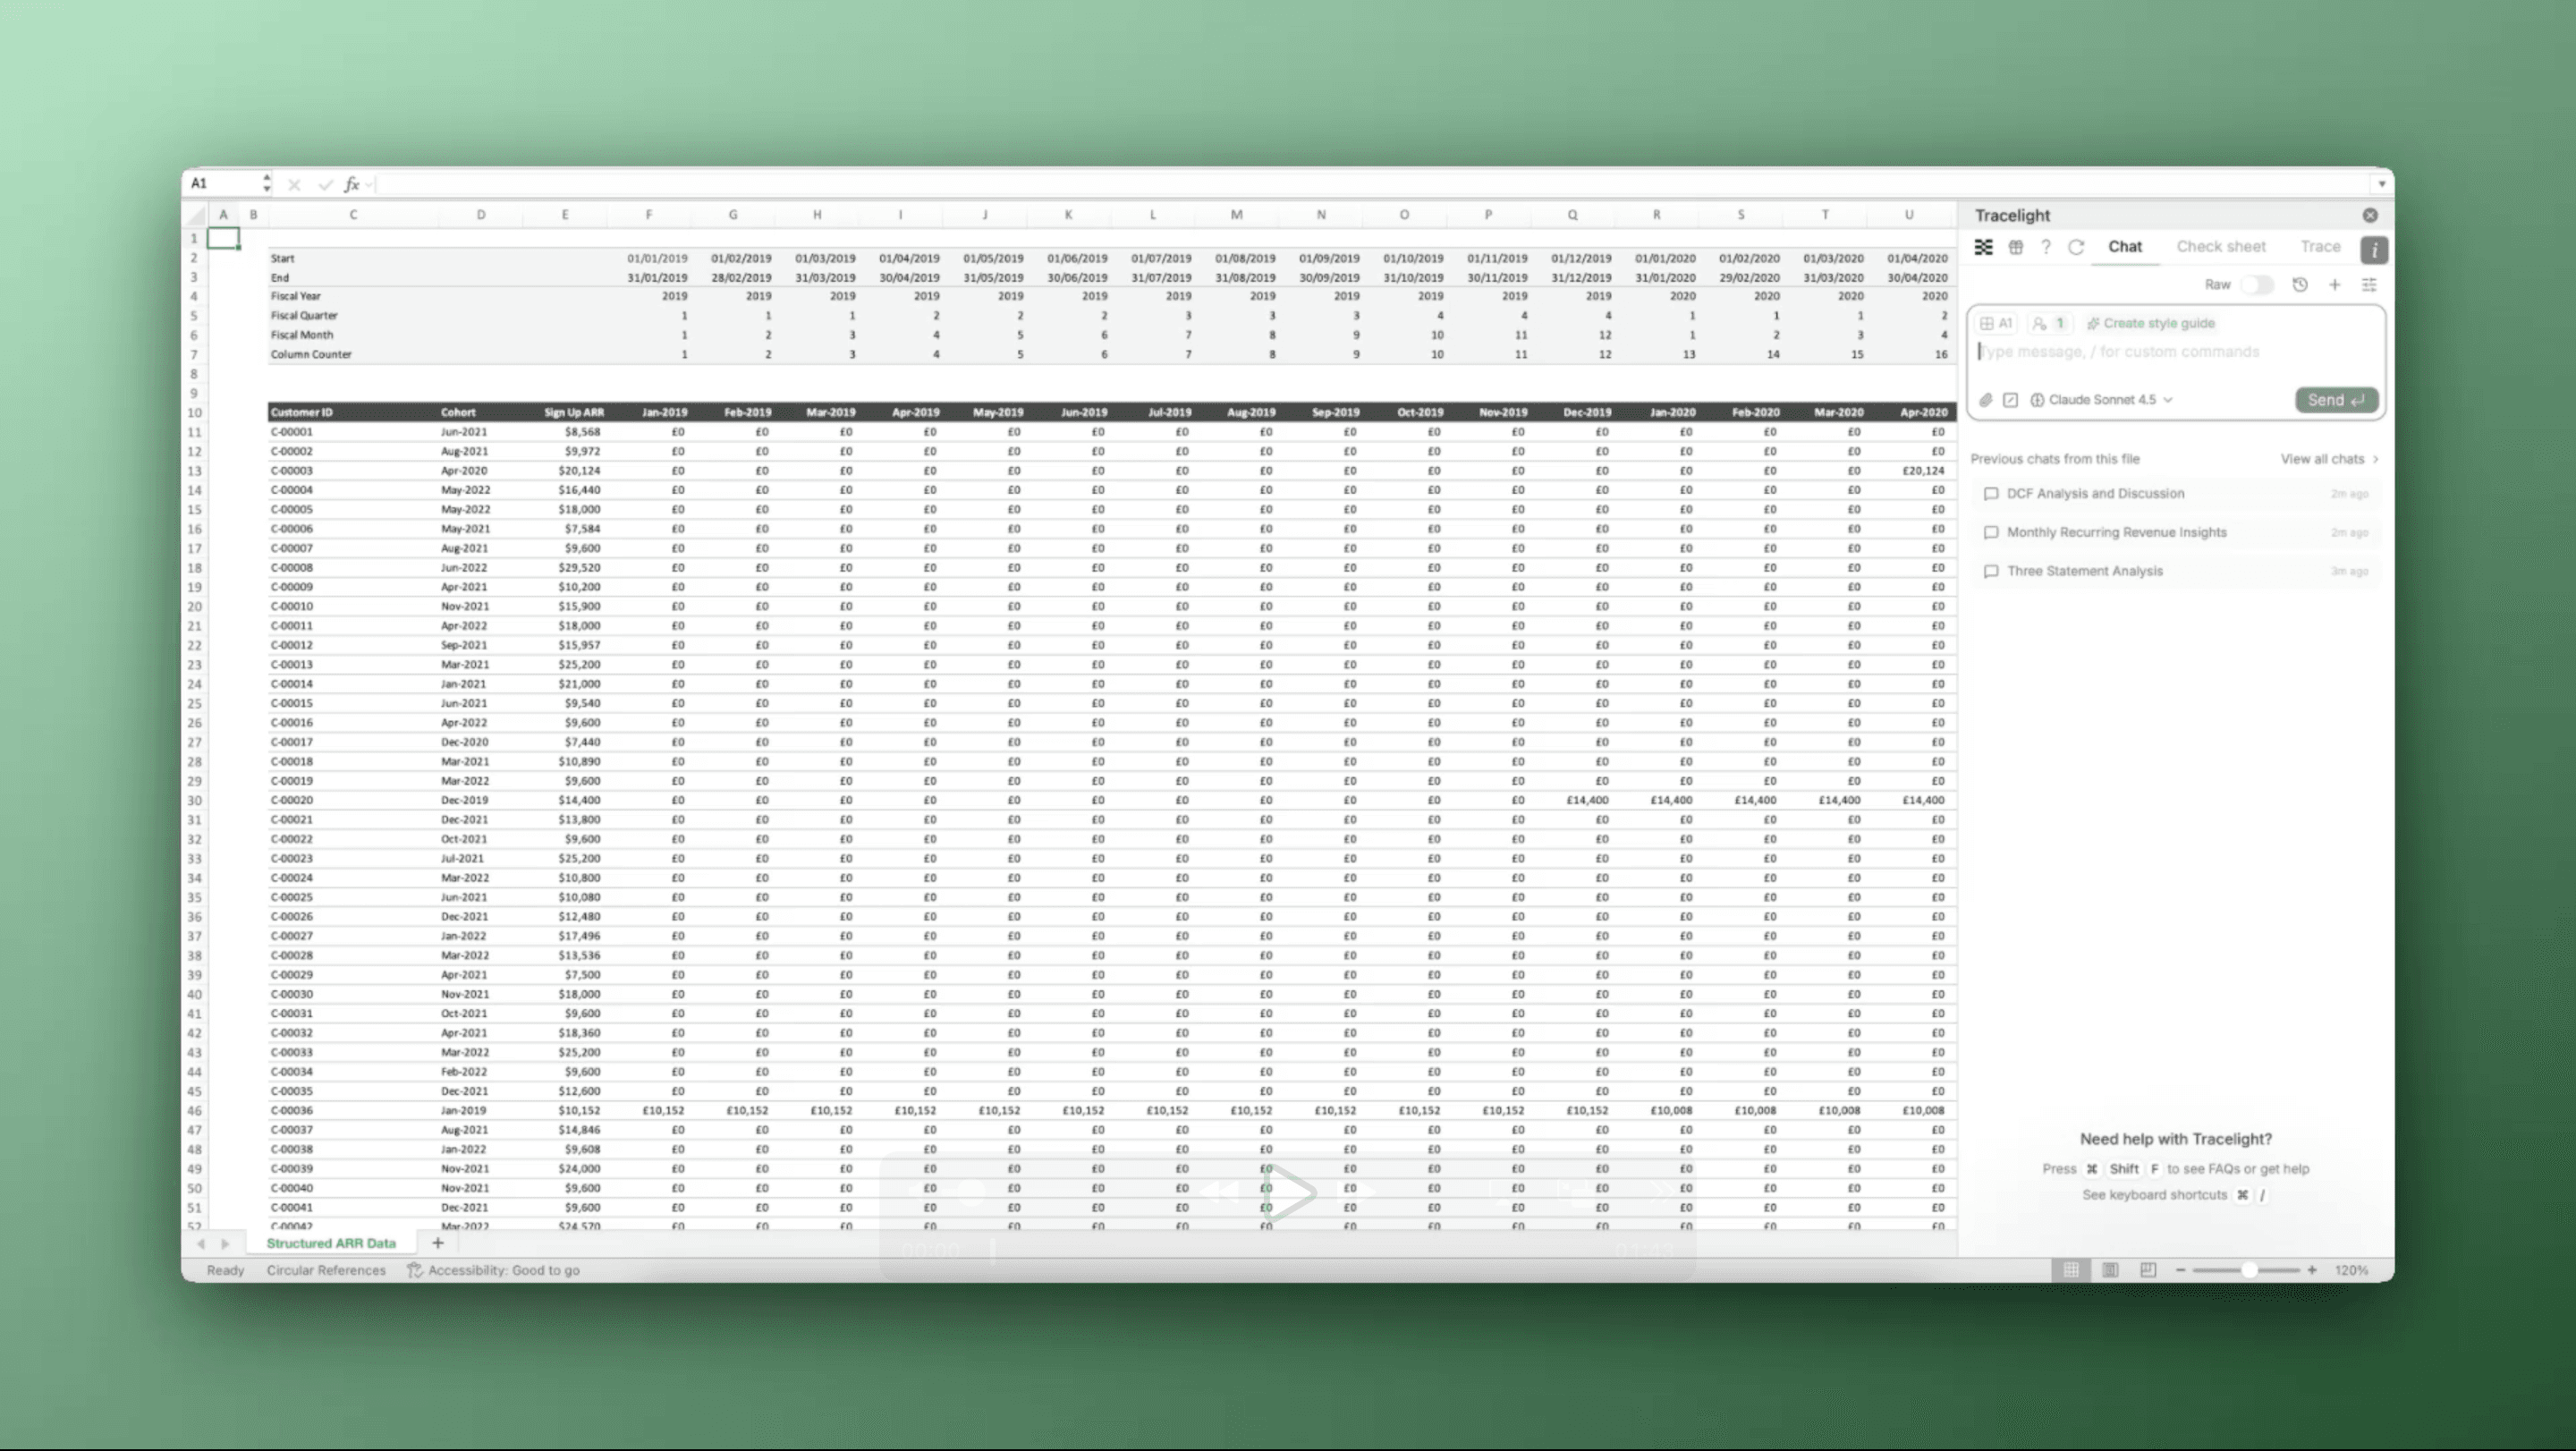
The starting point is a structured dataset in Excel: customer IDs running down the rows, with each column representing a month's ARR figure. This is the standard format most finance teams export from their billing or CRM system. You open a new sheet, label it ARR Snowball Analysis, and prepare to run the build.
Step 2: Execute the ARR Snowball via a Custom Workflow
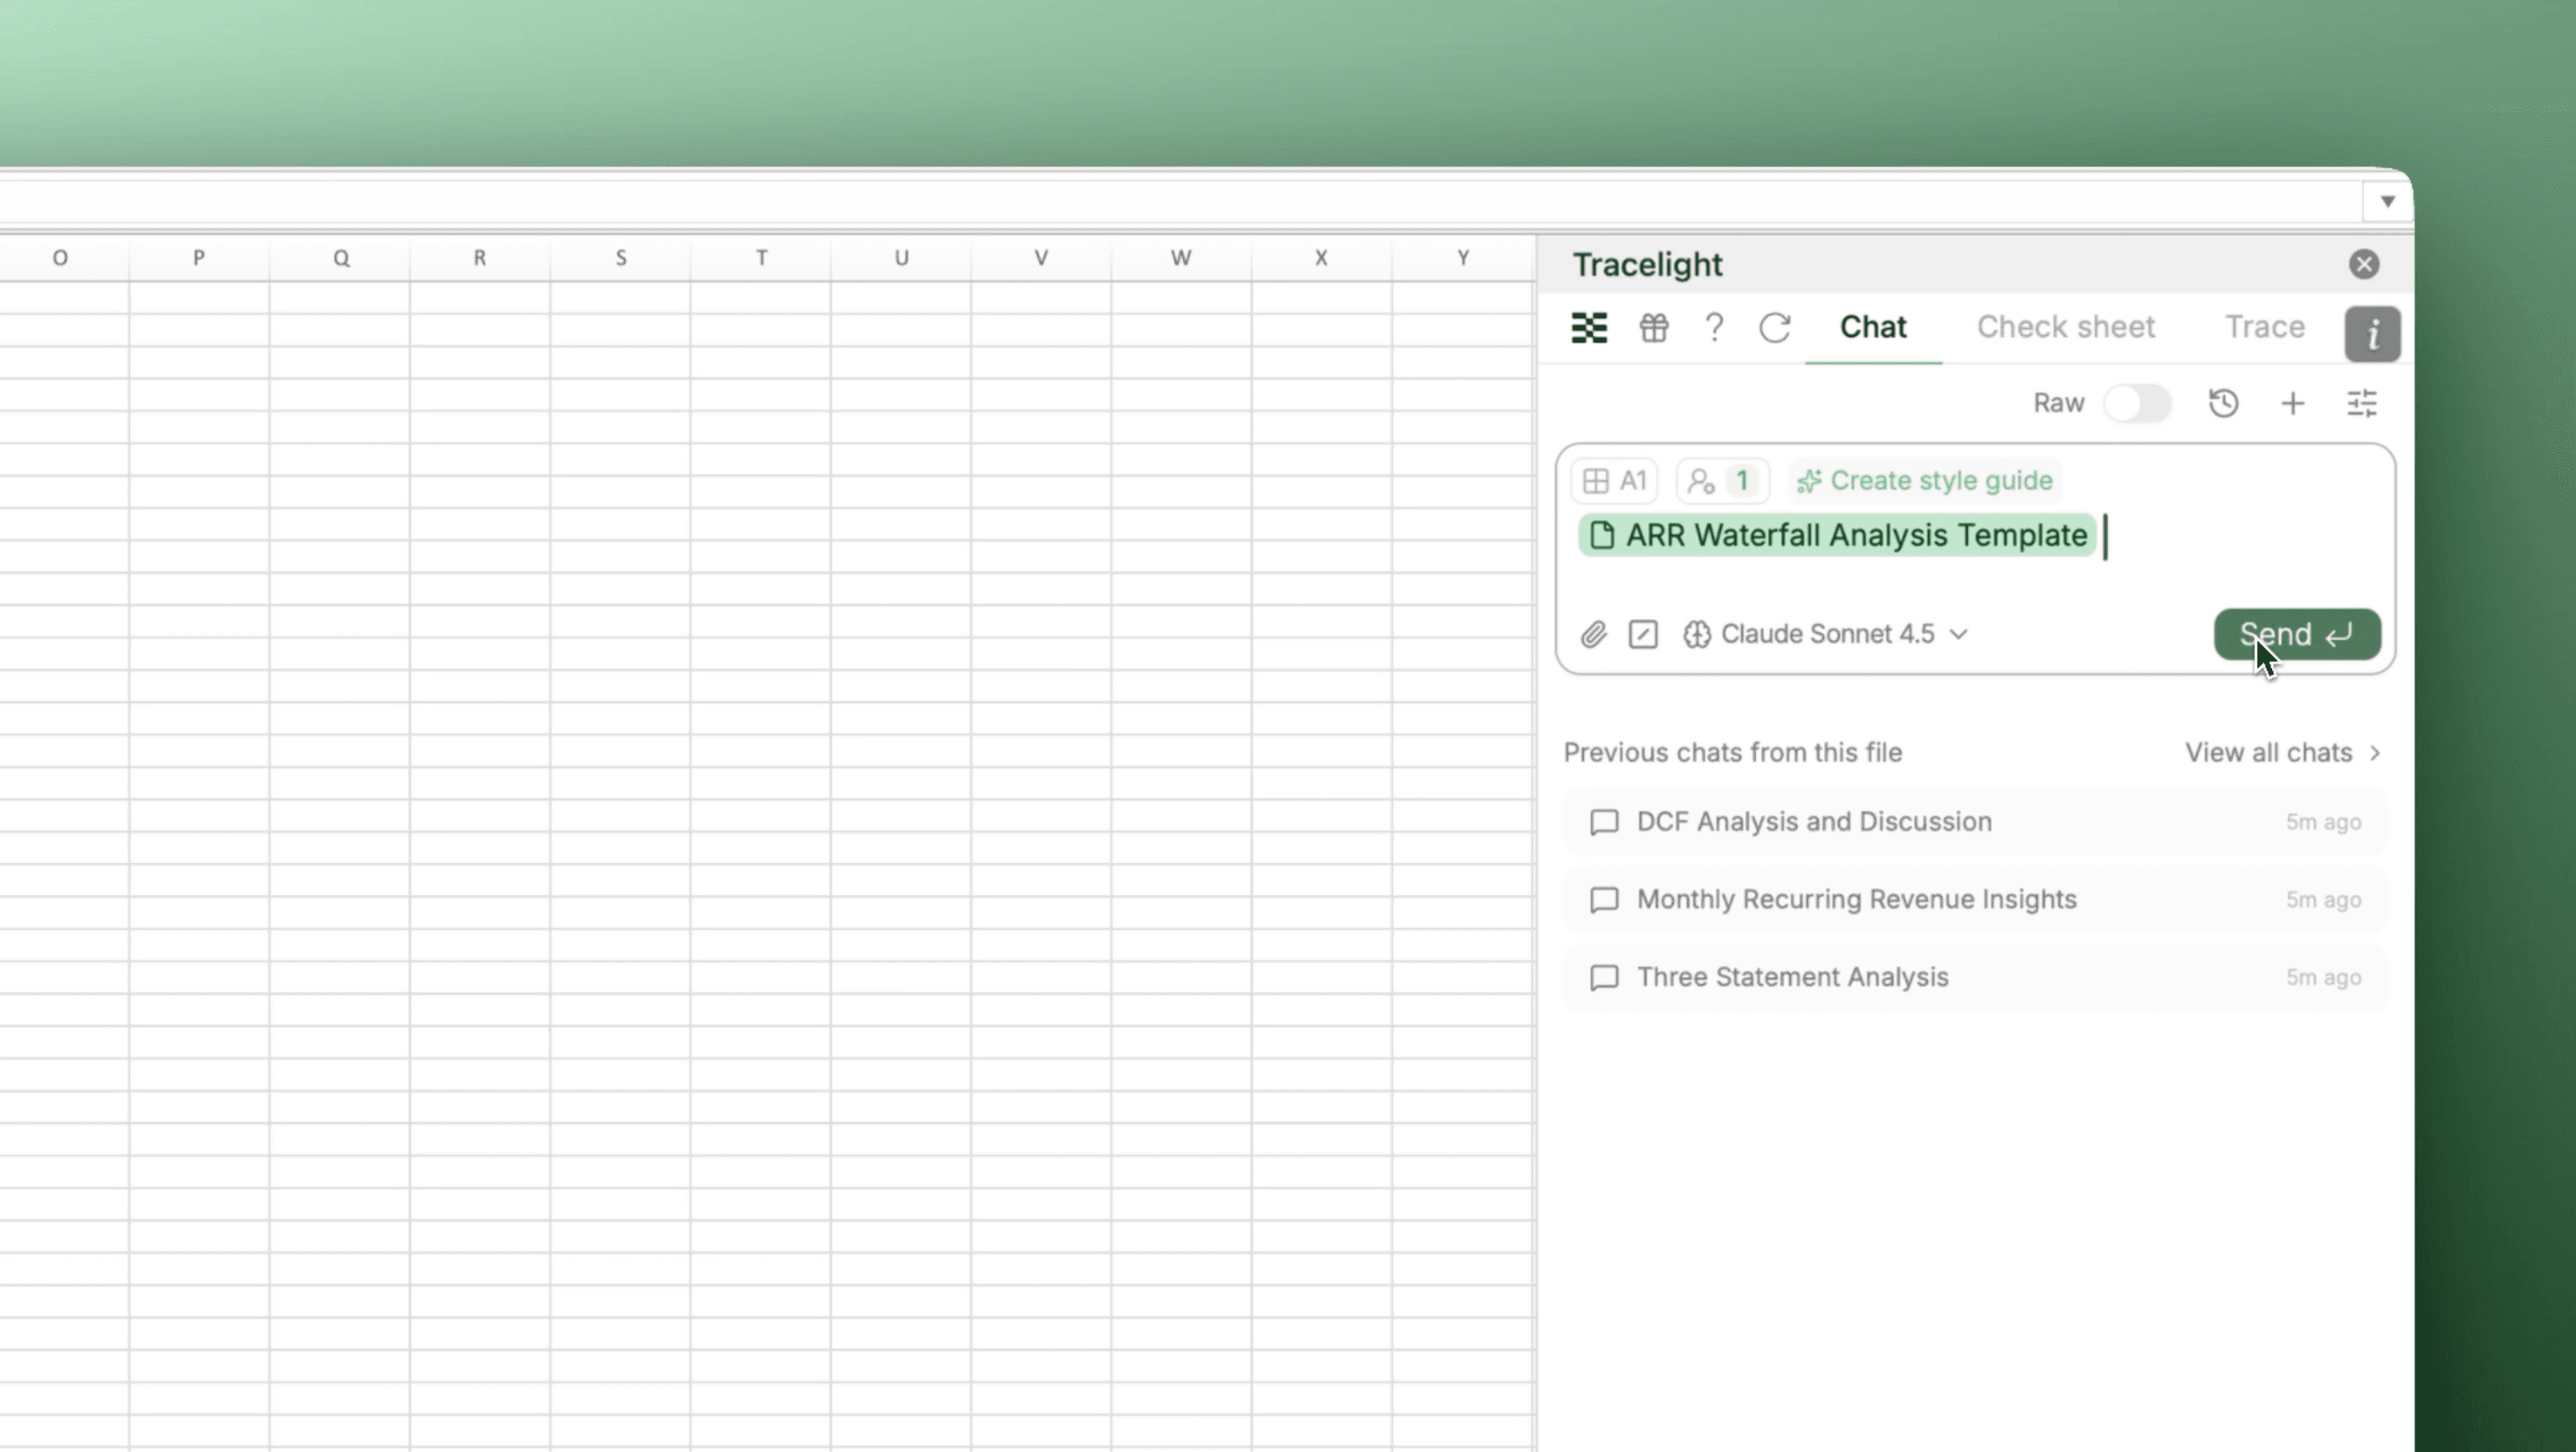
You trigger a saved Workflow in Tracelight's Workflows panel. The Workflow contains the full prompt specifying how ARR movements should be classified and how the bridge should be structured. Because the command is saved, it is fully editable. You can adjust classification rules, formatting, or output structure to match your firm's standards before or after execution. One click, and Tracelight processes the dataset.
Step 3: Review the Auditable ARR Bridge
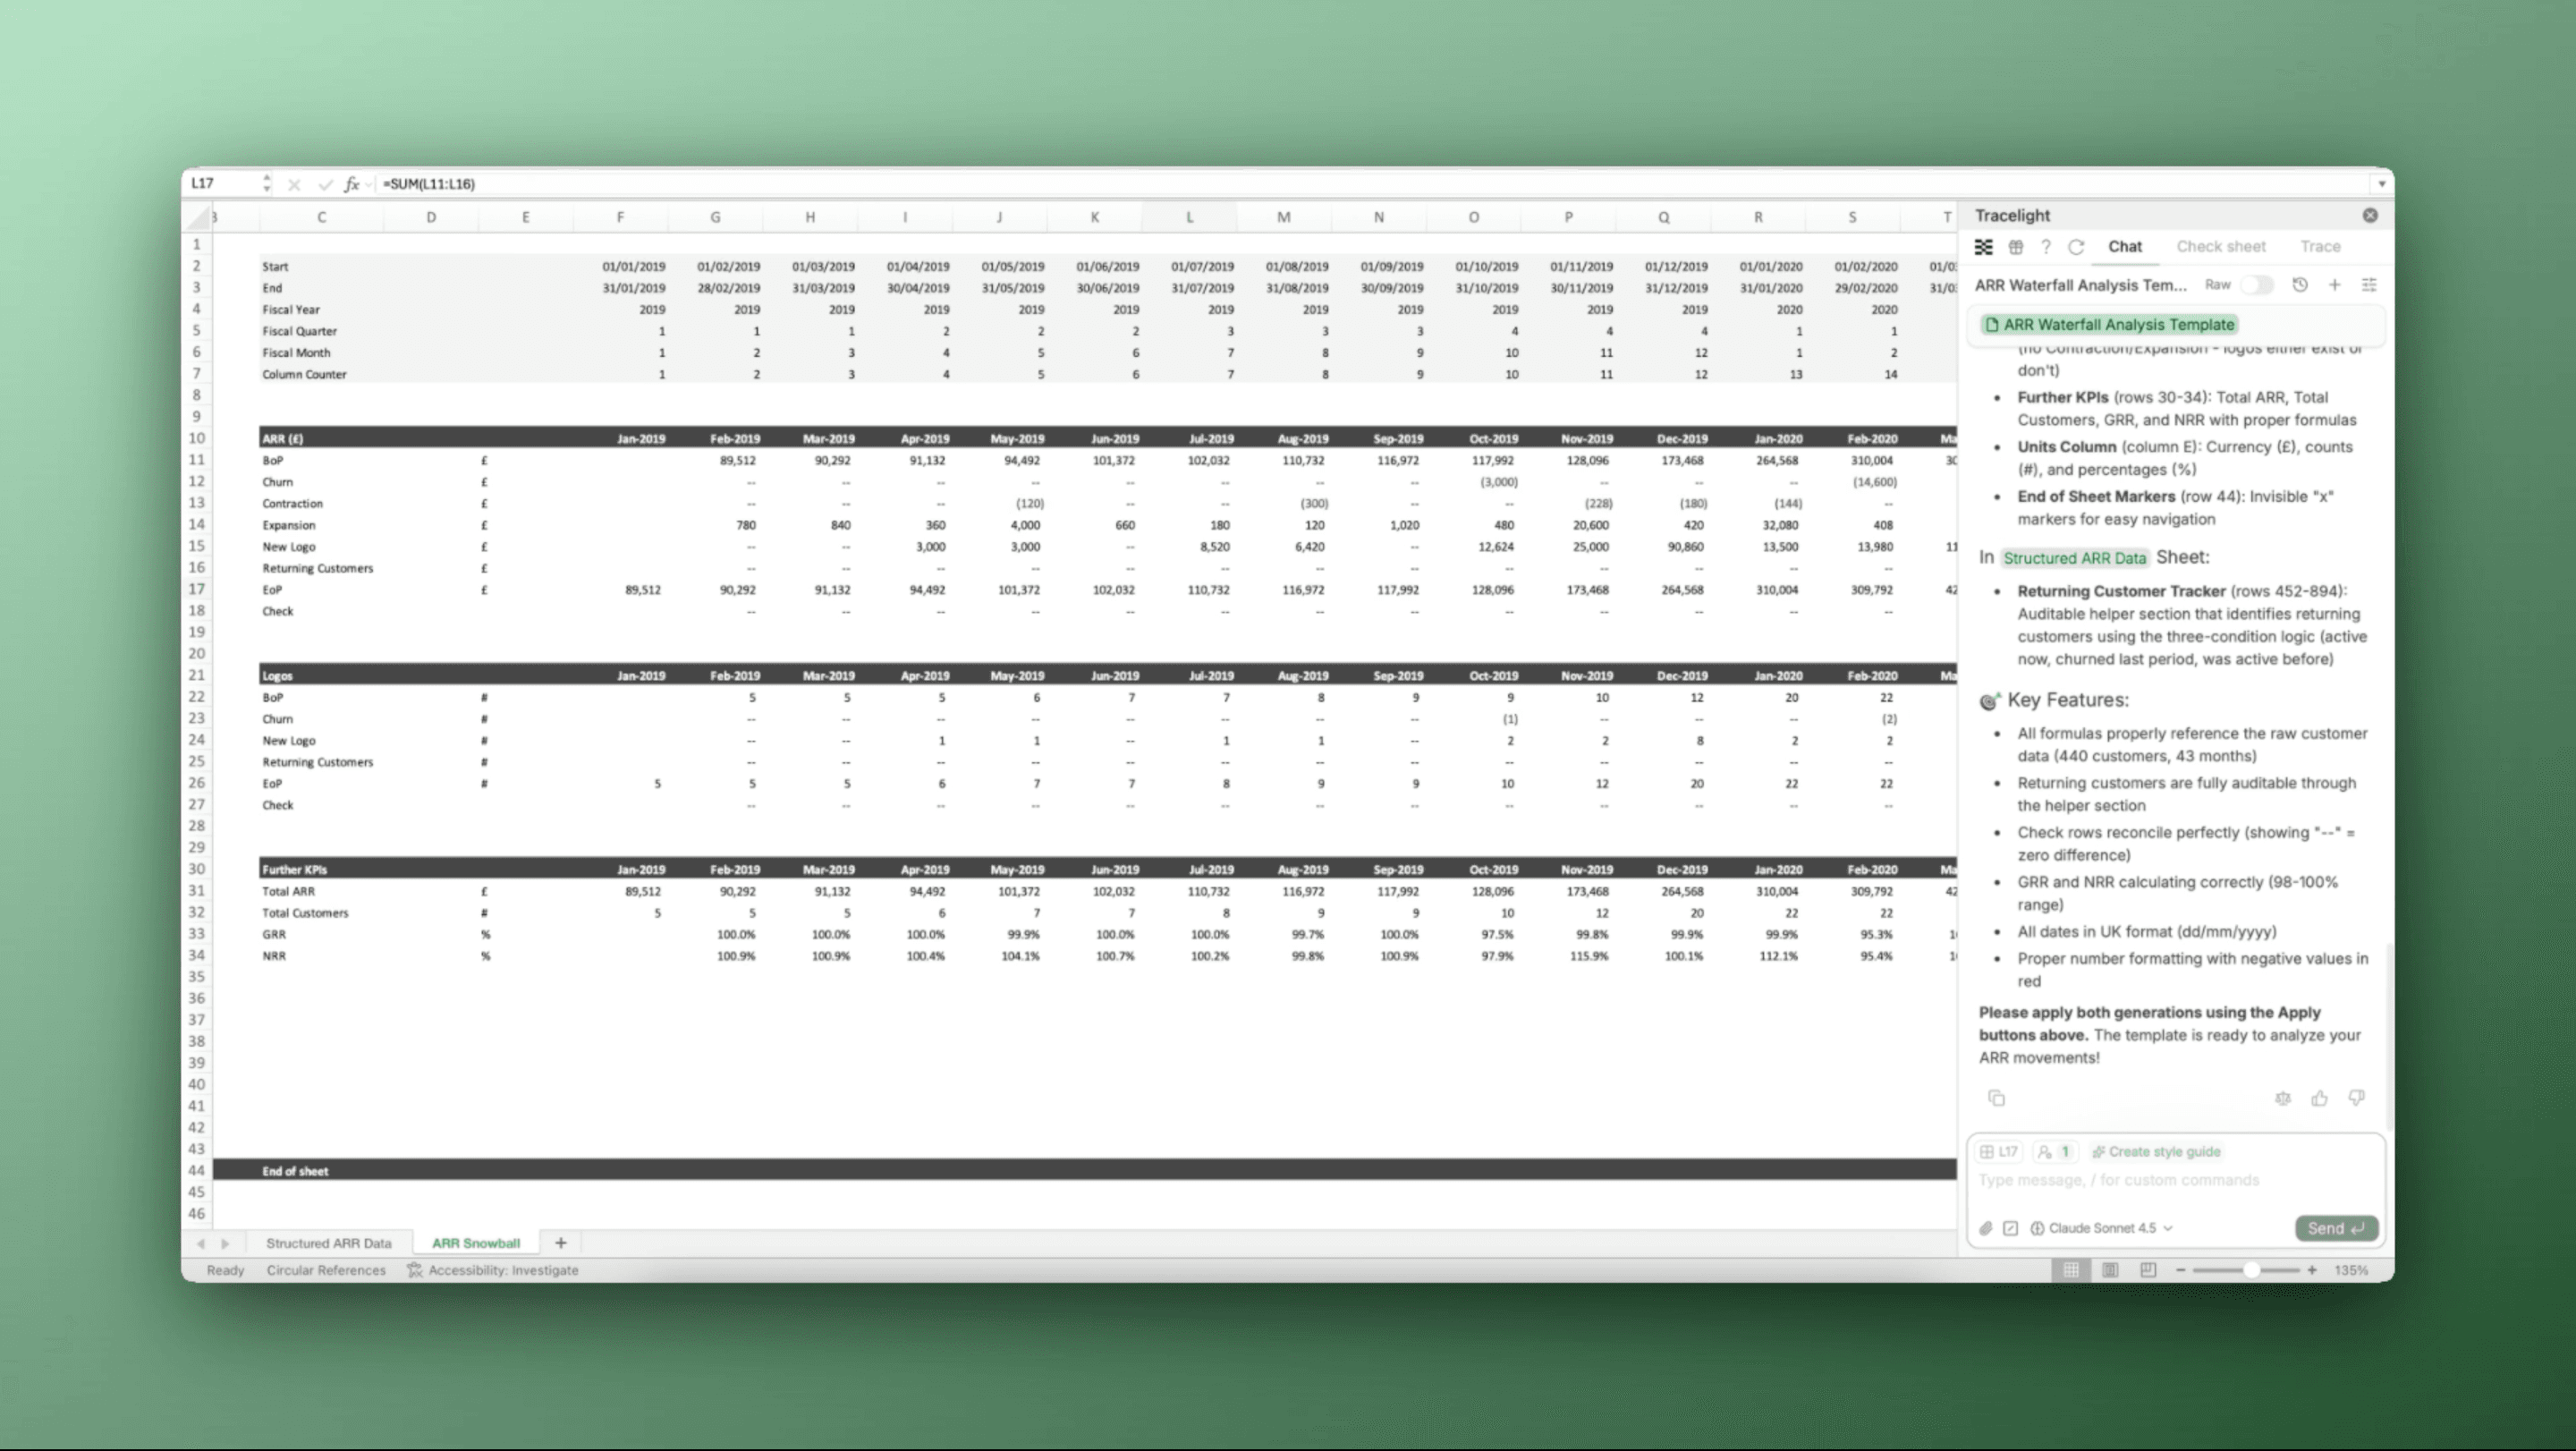
Tracelight returns a complete ARR bridge: beginning ARR, new logo, expansion, contraction, churn, and ending ARR, broken out by month. Every figure is formula-driven and fully auditable, built to the standard you would expect from a professional analyst. The output sits in your workbook, ready to sense-check, extend, or drop into a board deck. And because the Workflow is reusable, running the same analysis next quarter (or on a different portfolio company) takes seconds.
The Result
An ARR snowball analysis that would typically require hours of manual formula writing and classification logic completes in minutes. The output is auditable, repeatable, and formatted to your team's standards. With Tracelight's Workflows, the command is saved once and reused across datasets, turning a recurring analytical task into a single-click operation. For PE firms and SaaS finance teams managing multiple portfolio companies, that compounds quickly.
Frequently Asked Questions
Q: Can Tracelight's AI for Excel build an ARR snowball analysis?
A: Yes. Tracelight AI reads monthly subscription data directly in Excel and classifies each customer-month movement into new logo, expansion, contraction, and churn, producing a fully formula-driven ARR bridge without leaving your spreadsheet.
Q: How does AI for Excel automate ARR waterfall analysis across multiple portfolio companies?
A: Tracelight's Workflows feature lets you save the ARR snowball prompt as a reusable command. Once configured, your team can run the same analysis on any new dataset with a single click, adjusting classification rules or output formatting as needed.
Q: Why use AI for Excel to build ARR snowball analyses instead of doing it manually?
A: Manually building an ARR bridge means writing classification logic for every customer-month pair, handling edge cases like reactivations and partial churn, and assembling an auditable output. AI for financial modelling in Excel reduces that from hours of formula work to minutes, with fully traceable formulas and a reusable workflow for future periods or additional portfolio companies.
Speak with our specialists
Contact Us