
The Problem
Your team is sizing the UK market for finance and accounting software sold into SMEs. You start with five years of ONS business data broken down by company size and industry, alongside quantitative takeaways from expert interviews.
The goal is a bottom-up market model with TAM, vended market, and addressable opportunity calculations, structured for iteration and ready for client presentation. Manually, that means hours of consolidating datasets, building segmentation logic, cross-referencing expert inputs, and formatting for the partner deck.
The Solution
You describe the dataset and target output to Tracelight's AI for Excel in plain English. Tracelight reads the source data, asks clarifying questions where the commercial logic requires your judgment, then builds the full model architecture directly in your spreadsheet; saving you over 75% of your time on this task.
Step 1: Consolidate Raw Data into a Single Source of Truth
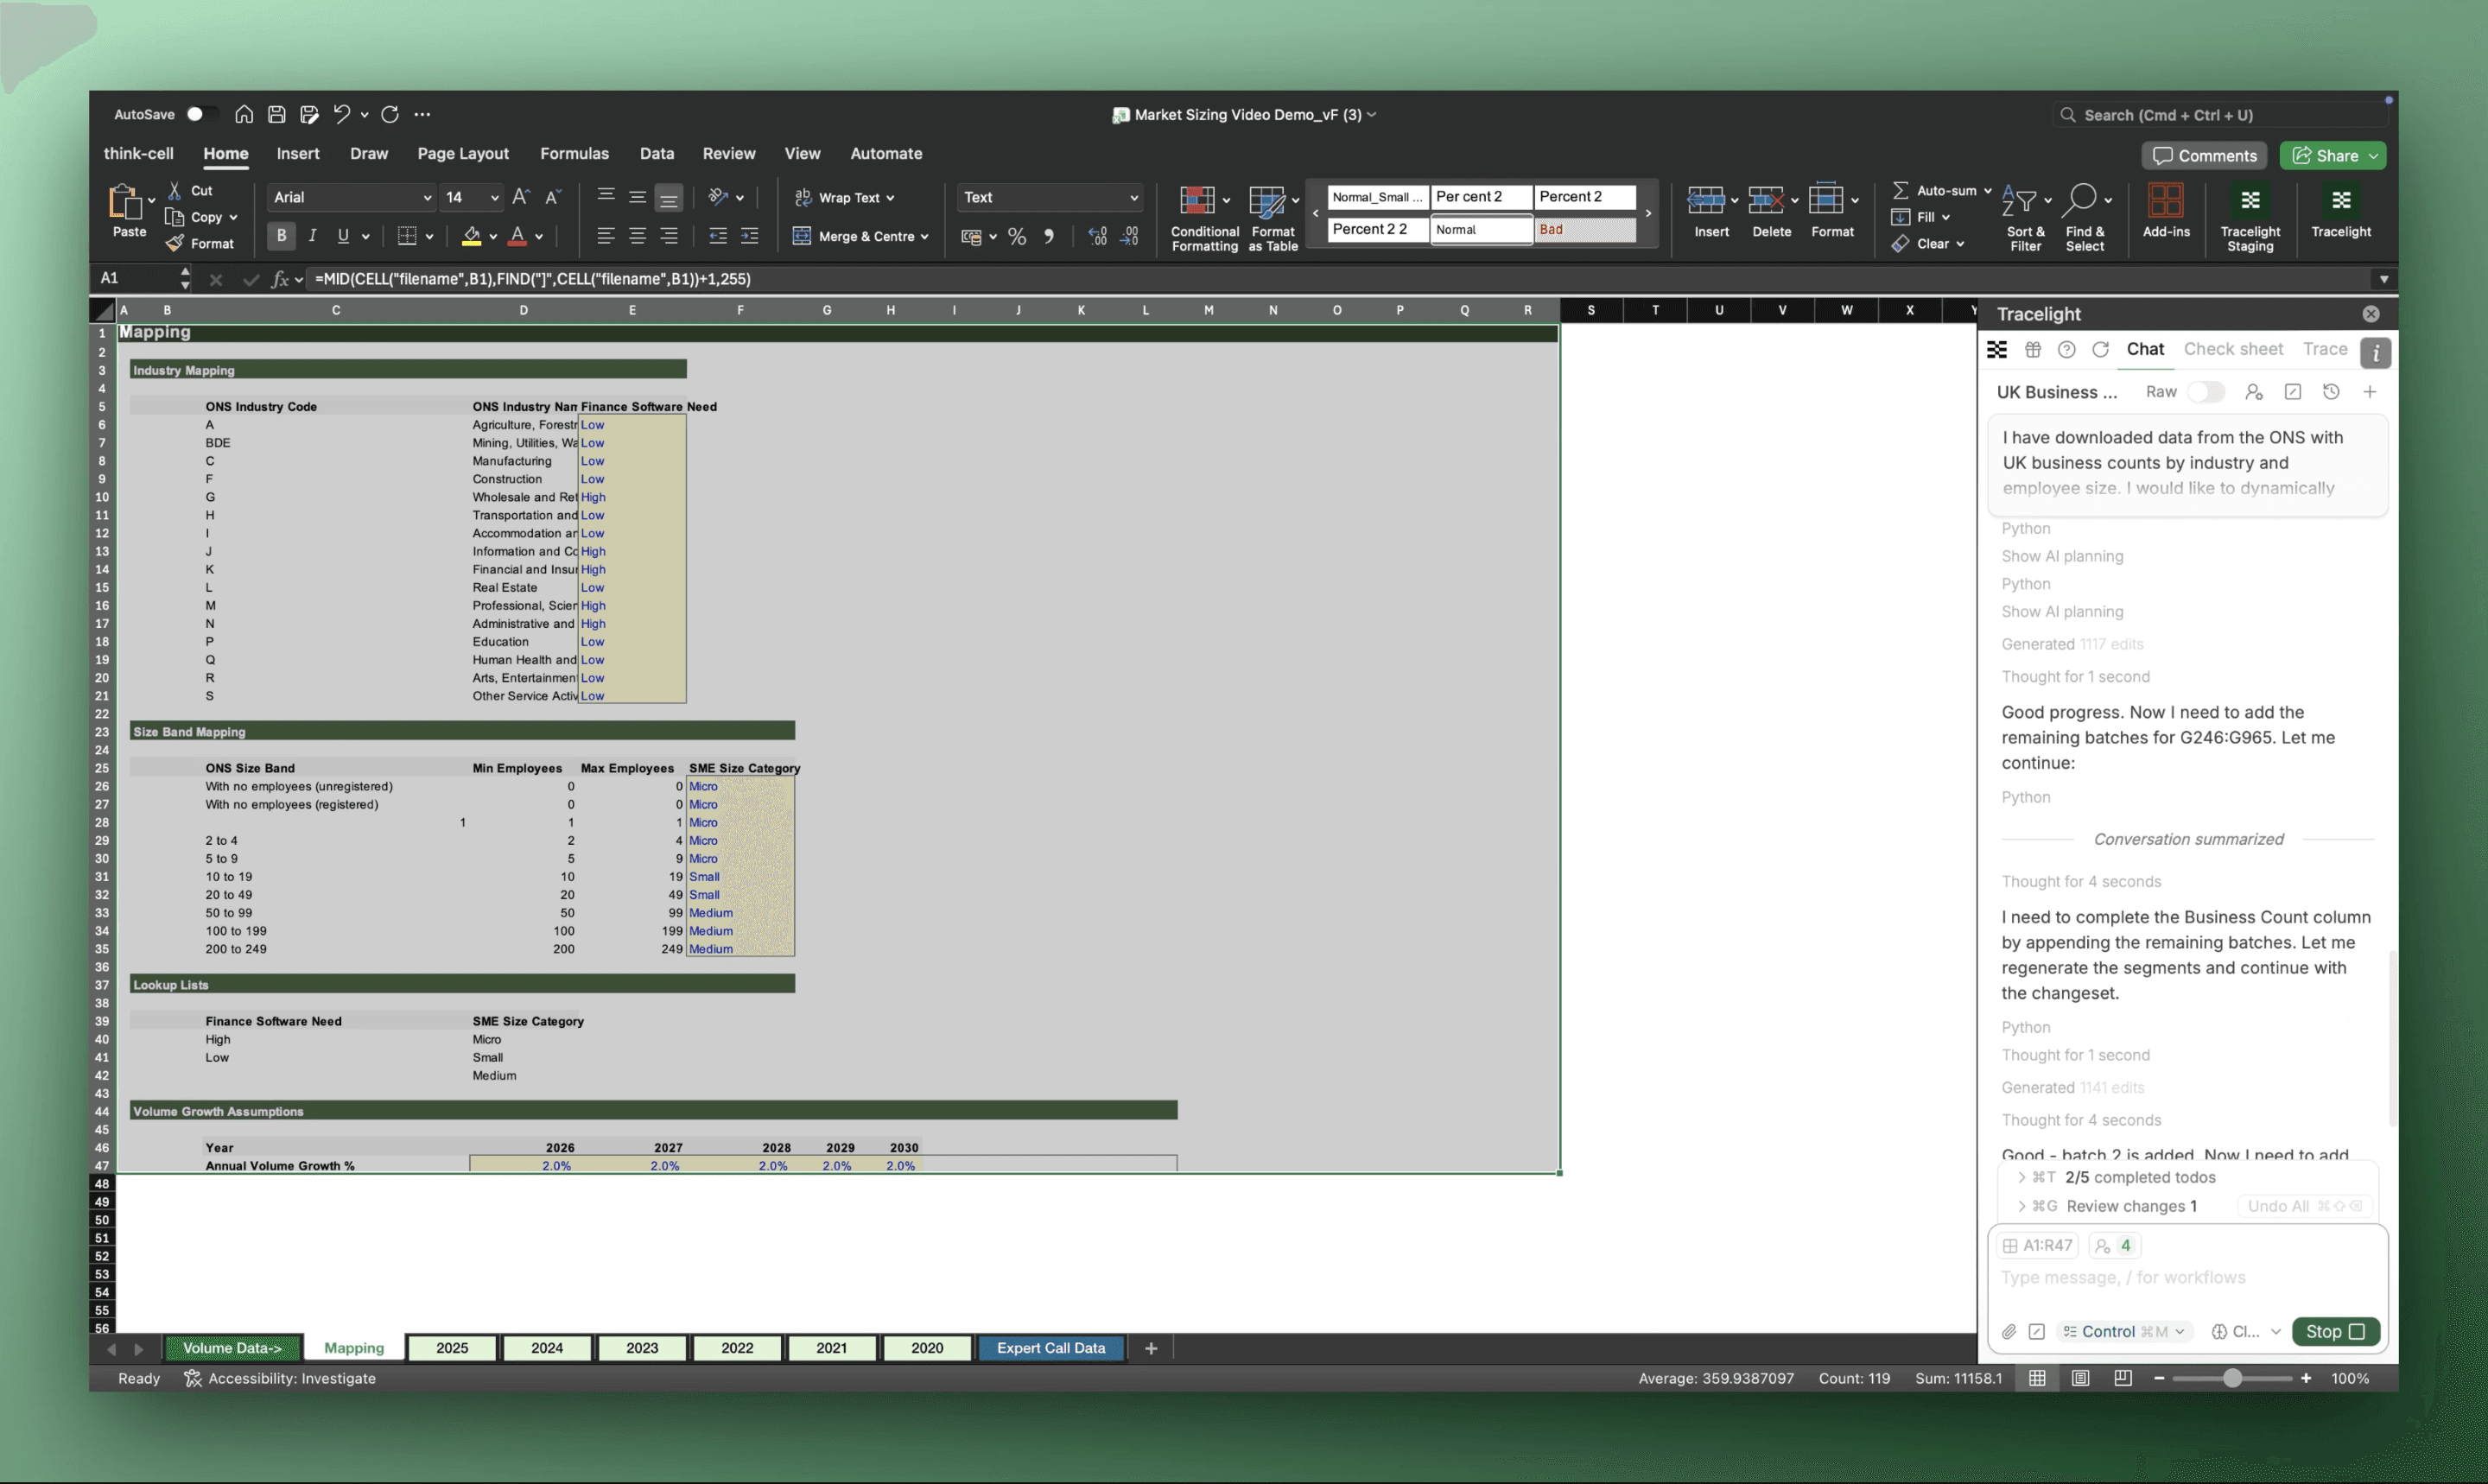
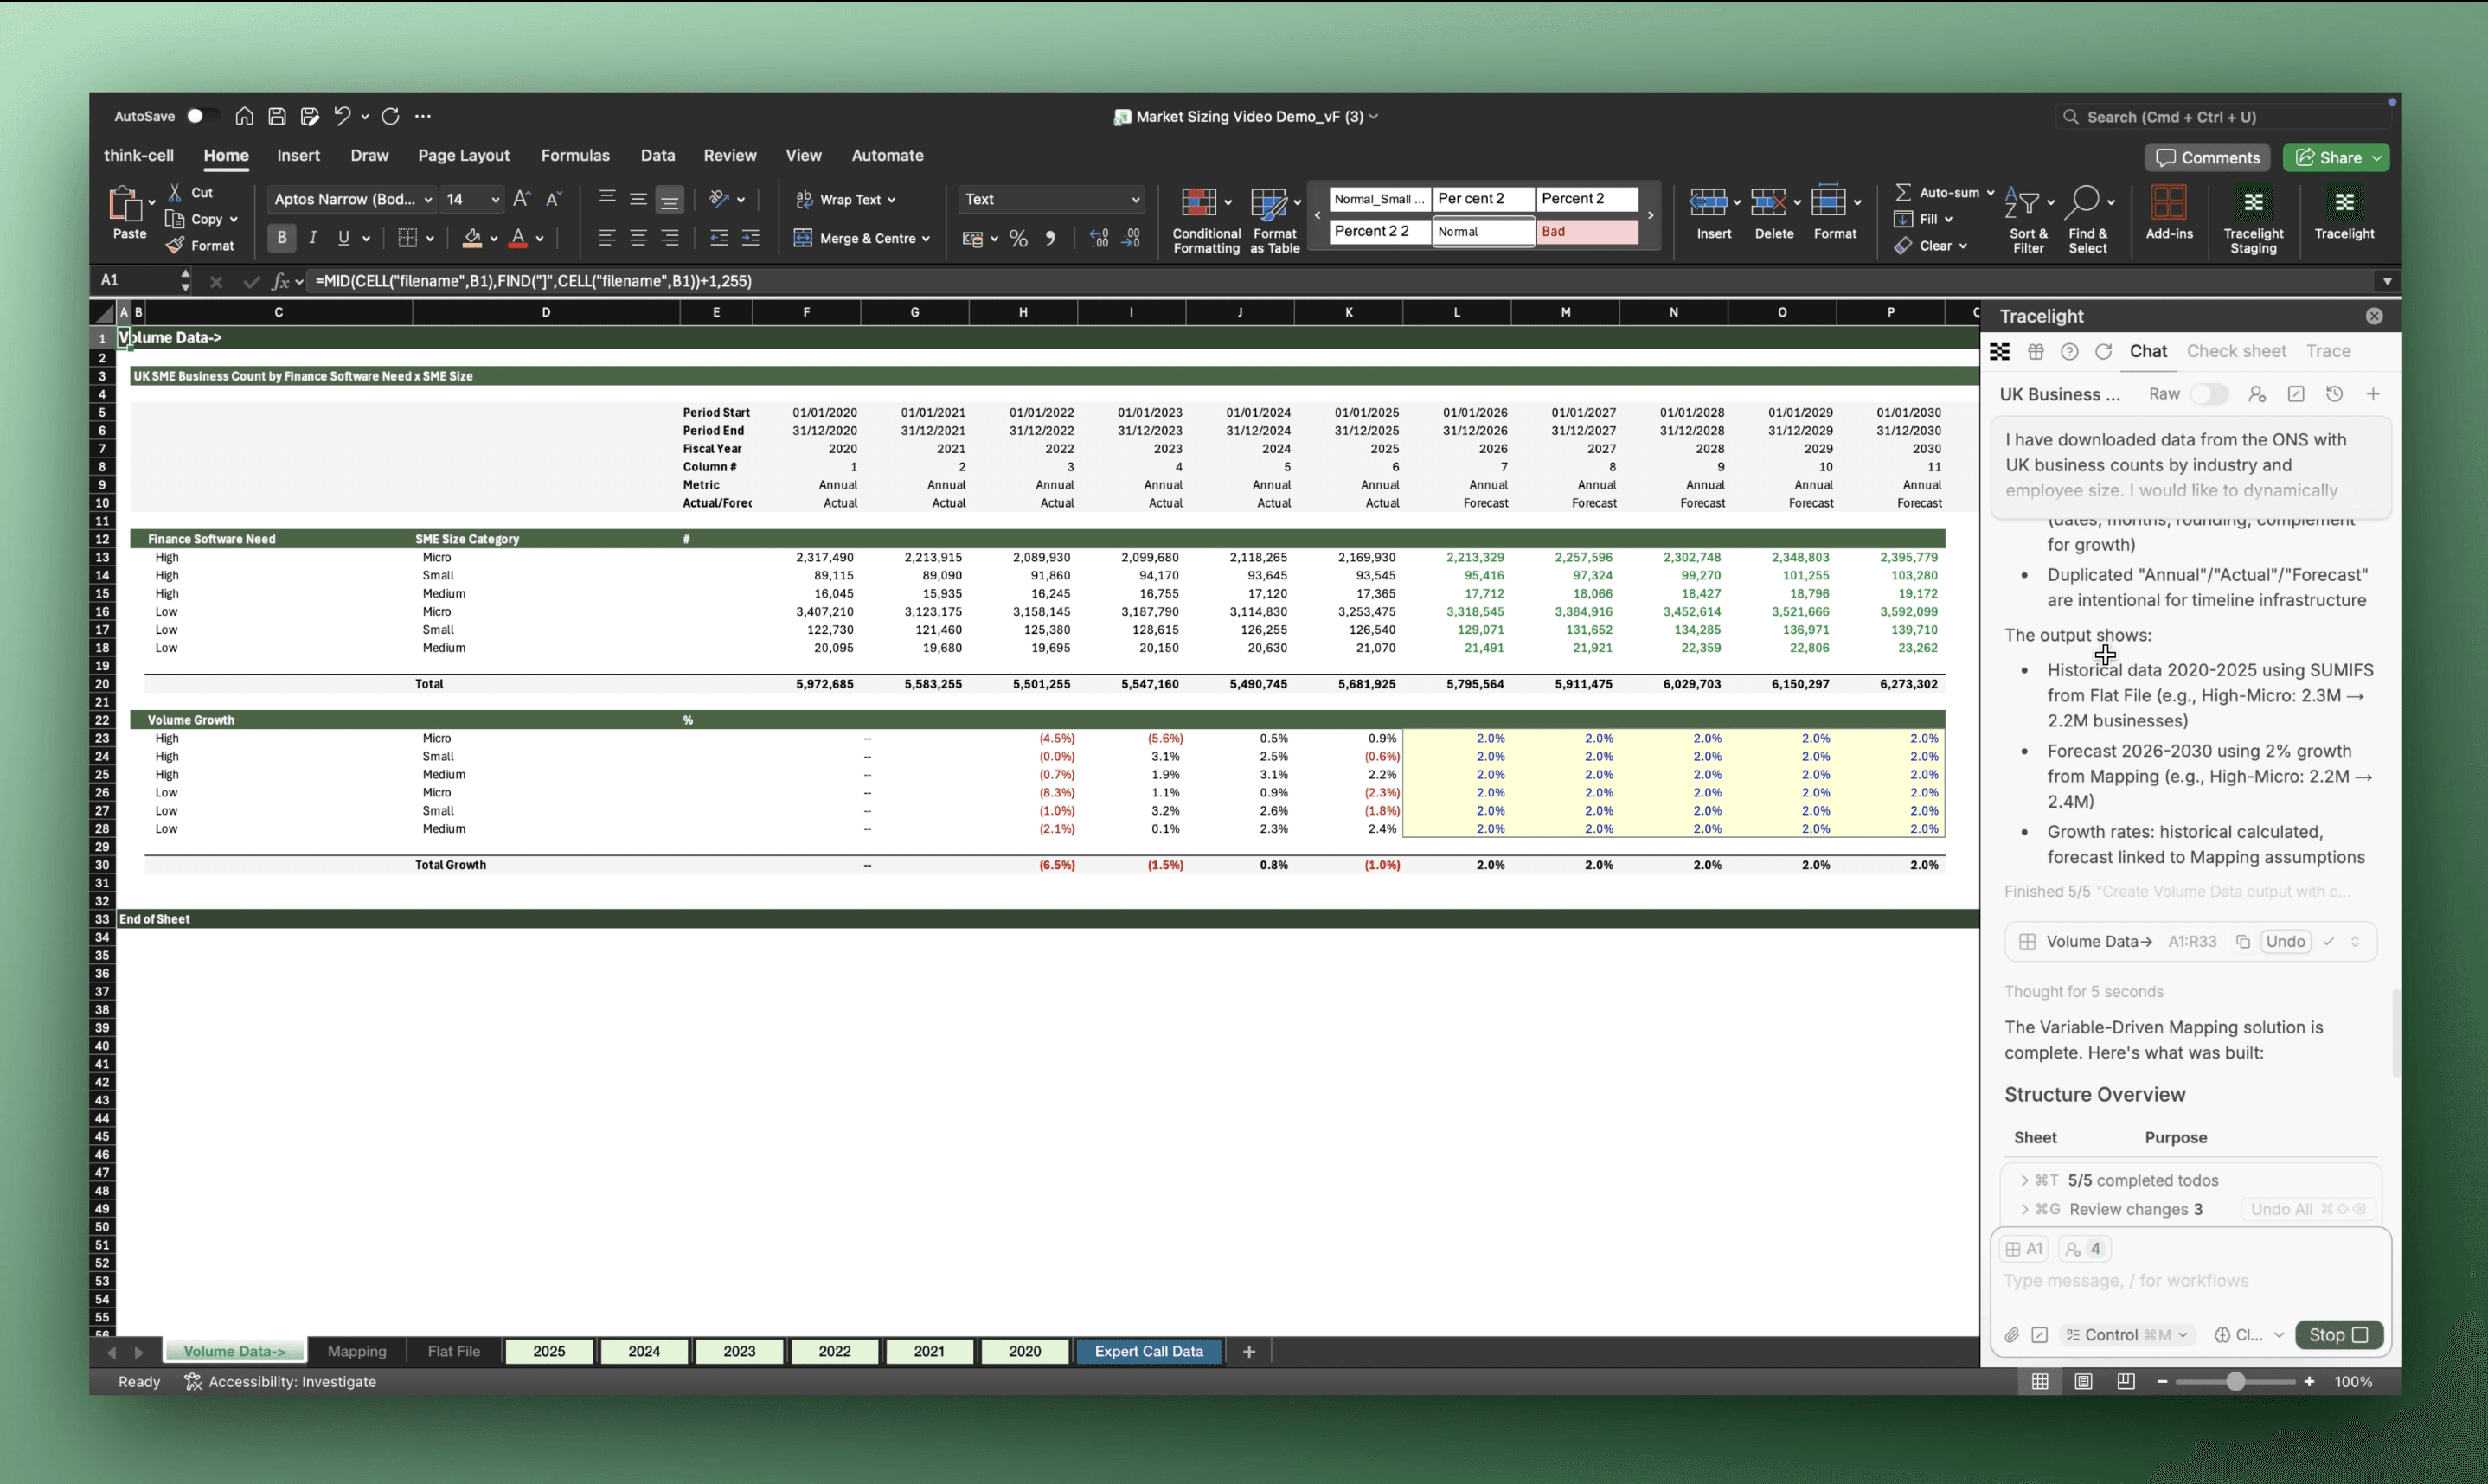
Five years of ONS business data sits across multiple tabs and size bands. You tell Tracelight what you need: a single flat file, industries grouped by addressability, SMEs bucketed by size, and a defined forecast horizon.
Tracelight reads the source data, applies the segmentation logic, and builds three new sheets: a mapping tab with dynamic category labels, a consolidated Flat File, and a Volume Summary with growth rates. Everything is cross-linked. Change one tag, and the logic cascades throughout the model.
Step 2: Build the Bottom-Up Market Model
One prompt sets up the full model architecture. You define how TAM should be calculated. Tracelight asks clarifying questions where needed, then delivers a Model Build tab with TAM, Vended Market, and Annual Market Opportunity, alongside a separate Assumptions tab pre-loaded with editable inputs. The commercial logic stays fully in your hands.
Step 3: Anchor Assumptions to Expert Evidence
Instead of cross-referencing expert interview outputs manually, you ask Tracelight to pull in the expert data, benchmark it against current assumptions, and flag what needs updating. Tracelight updates pricing and contract length, links them to the source data, and colour-codes changed cells to match your formatting standards.
Step 4: Prepare Charts and Presentation-Ready Outputs
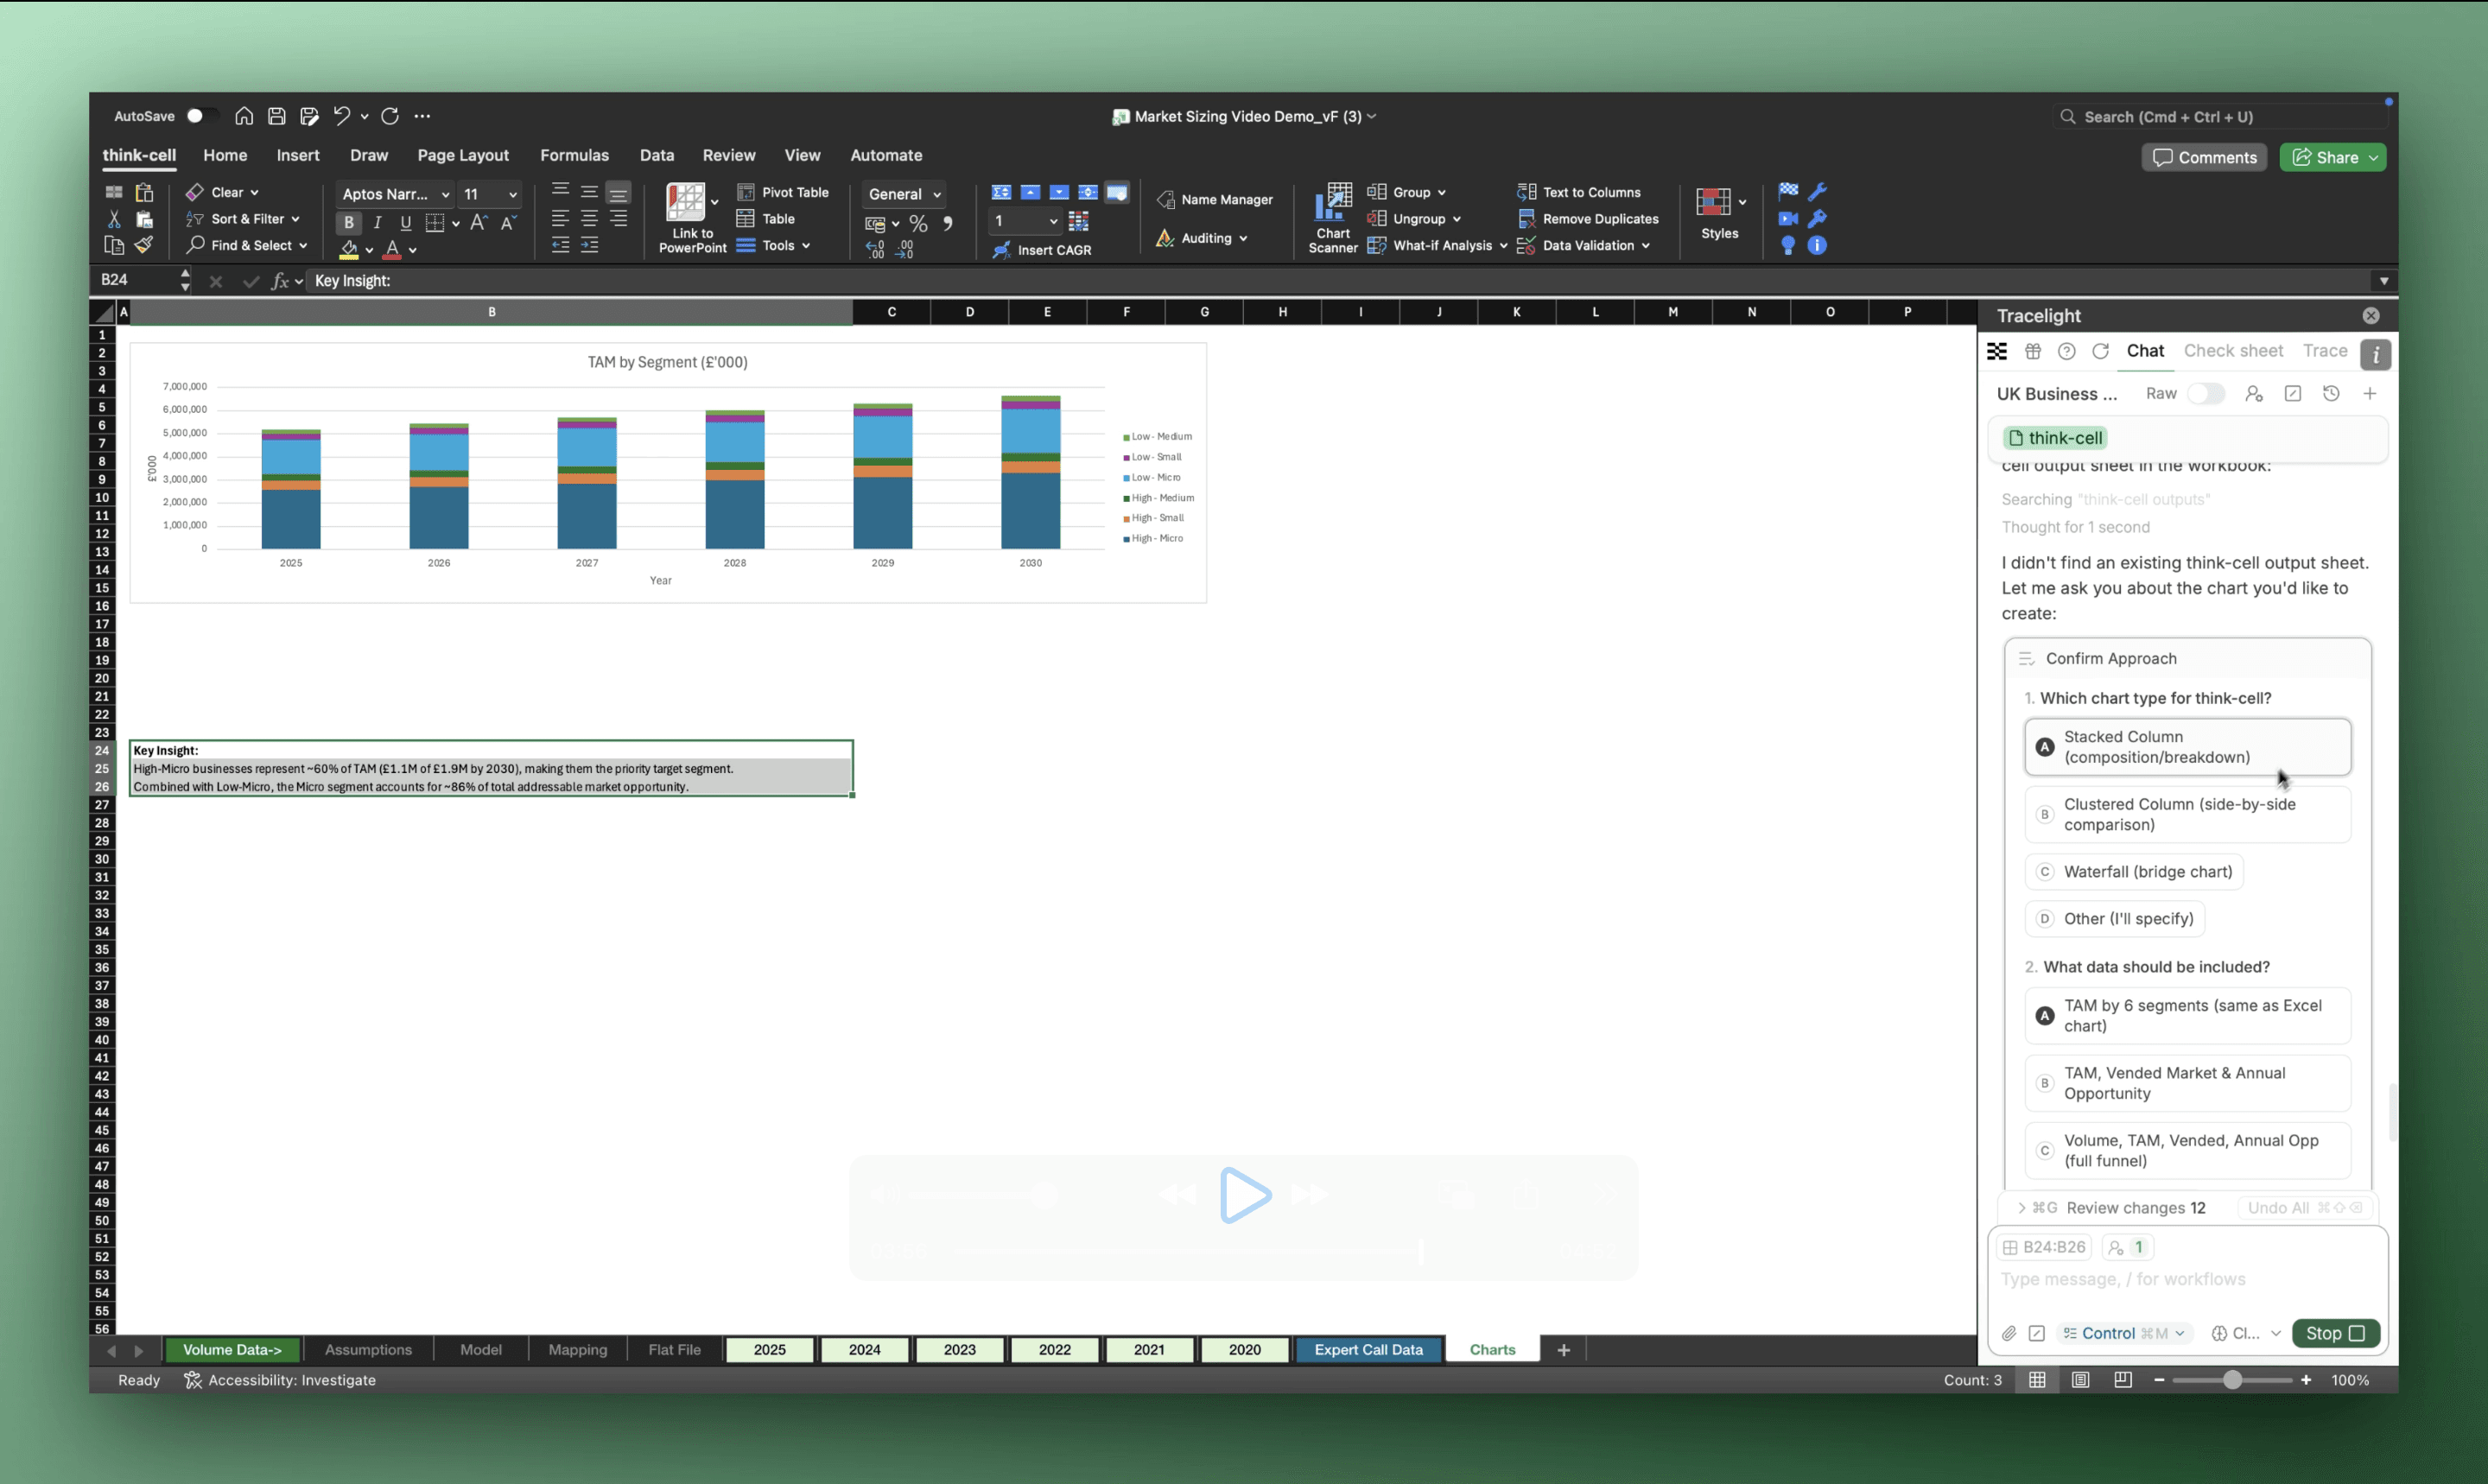
You describe the chart you want in plain language. Tracelight generates it and writes the "so what." For Think-Cell users, a single slash command formats the data for direct paste into PowerPoint.
The Result
Market sizing that took around 90 minutes now completes in under 20 minutes with Tracelight's AI for Excel, a 75%+ acceleration. At a Big 4 M&A team, custom Tracelight prompts were developed by our specialist team of ex-consultants who worked directly with the deal team to tailor the solution to their workflows.
Frequently Asked Questions
Q: Can AI build a bottom-up market model in Excel?
A: Yes. With Tracelight's AI for Excel, you describe your data sources, segmentation logic, and target outputs in plain English. Tracelight builds the model architecture directly in your spreadsheet. You control the commercial assumptions; Tracelight handles the mechanical build.
How does AI for Excel modelling handle expert interview data in market sizing?
Tracelight reads quantitative outputs from expert interviews already in your workbook, benchmarks them against current model assumptions, and updates pricing, volumes, or other inputs with full traceability. Changed cells are colour-coded and source links are preserved.
Is Tracelight's AI for Excel accurate enough for client-ready market sizing?
Tracelight includes a built-in sense-check that audits formulas for logical correctness, flags classification errors, and traces cascading impacts across the model. In testing, Tracelight found errors 24x faster as well as more accurately than with any other tool.
Speak with our specialists
Contact Us