Client
Big 4 Management Consultancy
Use Case
Building Models
We’re working with a Big 4 consultancy M&A team to dramatically speed up core due diligence, advisory, and transaction workflows.
Previously, revenue mapping took their team around 2 hours. Using a tailored, saved Tracelight prompt developed by our specialist team of ex-consultants, analysts now complete complex revenue mapping in minutes.
Meanwhile, market sizing took the team around 90 minutes on average. With a custom-developed Tracelight prompt specific to that workflow, market sizing work has been accelerated by over 75%.
Throughout the engagement, our team of ex-consultants worked side-by-side with the Big 4 M&A team to deeply understand their workflows before developing tailored solutions in Tracelight and onboarding each user individually.
The Problem
A strategy team is sizing the UK market for finance and accounting software sold into SMEs. They start with five years of ONS business data broken down by company size and industry, alongside quantitative takeaways from expert interviews.
The goal is a bottom-up market model with TAM, vended market, and addressable opportunity calculations - structured for iteration and ready for client presentation.
1. From Raw ONS Data to a Single Source of Truth
Five years of ONS business data sits across multiple tabs and size bands. The analyst tells Tracelight what they need: a single flat file, industries grouped by addressability, SMEs bucketed by size, and a defined forecast horizon.
Tracelight reads the source data, applies the segmentation logic, and builds three new sheets:
A mapping tab with dynamic category labels
A consolidated Flat File
A Volume Summary with growth rates
Everything is cross-linked. Change one tag, and the logic cascades throughout the model.
2. Bottom-Up Market Model in One Prompt
One prompt sets up the full model architecture. The analyst defines how TAM should be calculated. Tracelight asks clarifying questions where needed, then delivers a Model Build tab with TAM, Vended Market, and Annual Market Opportunity - alongside a separate Assumptions tab pre-loaded with editable inputs.
The commercial logic remains fully controlled by the analyst.
You have the skeleton of a bottom-up market model, built in minutes.

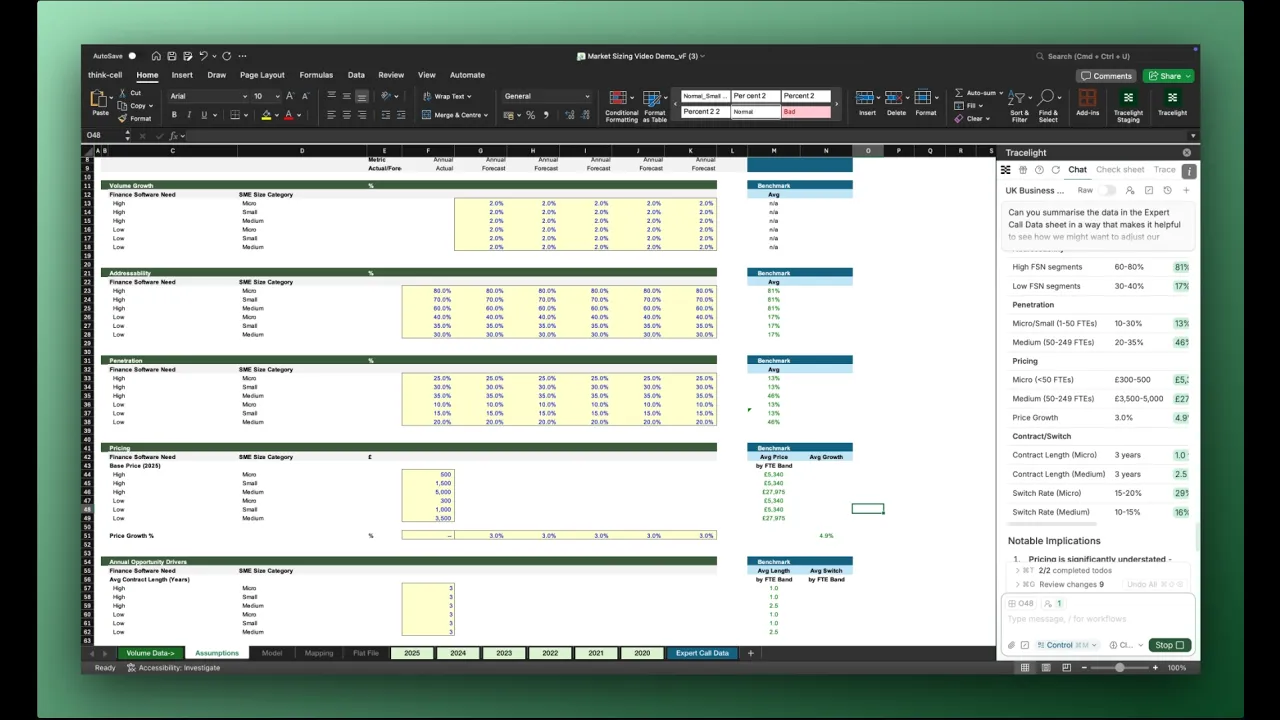
3. Assumptions Anchored to Expert Evidence
The workbook already contains quantitative outputs from expert interviews. Instead of cross-referencing manually, the analyst asks Tracelight to pull in the expert data, benchmark it against current assumptions, and flag what needs updating.
Tracelight updates pricing and contract length, links them to the source data, and colour-codes changed cells to match the team’s formatting standards. If additional expert interviews are added later, the summaries recalculate automatically.

4. QC and Refine
A Tracelight sense-check flags an issue: the micro-business segment includes companies with zero employees, inflating the total market.
Because segmentation is driven by a dynamic tagging sheet, the fix is one prompt. Tracelight reclassifies the data, the numbers cascade, and the addressable opportunity lands at a defensible figure; without manual rework.

5. Prepare the Output
Charts are the last mile. In Excel, the analyst describes the chart they want in plain language; Tracelight generates the chart and writes the “so what.”
For Think-Cell users, a single slash command formats the data for direct paste into PowerPoint. Every chart type is supported, from simple bars to views showing the market as a share of TAM..

If you’d like to see this process in detail, you can watch the demo below - featuring a step-by-step walkthrough by our consulting team specialist and Chief of Staff, Cat Lavender.
Speak with our specialists