
You're already able to export your Excel models to PowerPoints and Word docs with Tracelight. Today, we're adding something more exciting: interactive dashboards as webpages, generated directly from your spreadsheet.
What's new
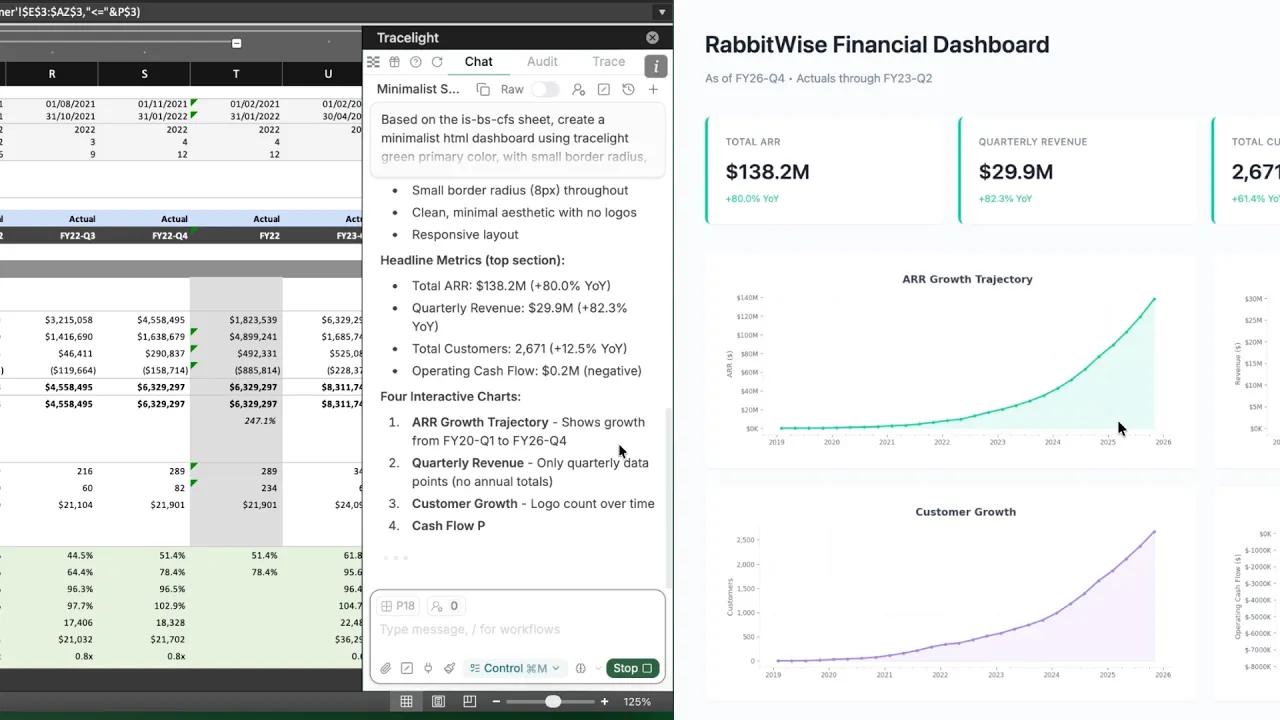
Open the Tracelight add-in, type what you want to see - the metrics, the charts, the layout - and Tracelight reads your model and does the heavy lifting. In seconds, you go from raw data to a shareable, client-ready web dashboard. No design skills needed. No exporting and reformatting.
Built for financial models
Financial models are dense by necessity. A three-statement model, an LBO, a DCF - these are built for rigour, not readability. The people who receive them are often brilliant, but they're not always going to open a 40-tab workbook and find the one number that matters to them.
Tracelight changes that. It reads your model and surfaces the data as a visually engaging, nteractive dashboard that anyone can navigate, without any need for technical design skills.
Why it matters
This isn't just about efficiency. It's about differentiation. Once your clients and team see dynamic artifacts like this, they won’t want to go back to the old way of doing things.
What's coming next
Over the coming days, we'll be adding chat directly to your webpages - so viewers can ask questions about the model - and native citation back to the underlying Excel cells. Every output, traceable to source. Every assumption, one click away.
Stay tuned for more soon - you can check out the demo video below from our CEO/Founder Pete to see how it works.

Contact Us